|
|
|
Indian Pediatr 2012;49:
124-128 |
 |
Potential Factors Related to Waist
Circumference in Urban South Indian Children
|
|
Rebecca Kuriyan, Tinku Thomas, S Sumithra, Deepa P
Lokesh, Nishita R Sheth, Renju Joy,
Swarnarekha Bhat* and Anura V Kurpad
From the Division of Nutrition, and *Department of
Pediatrics, St John’s Research Institute, St John’s National Academy of
Health Sciences and *St John’s Medical College, Bangalore, India.
Correspondence to: Dr Rebecca Kuriyan, Division
of Nutrition, St John’s Research Institute, St John’s National Academy
of Health Sciences, Bangalore 560034, India.
Email: [email protected]
Received: September 03, 2010;
Initial review: October 22, 2010;
Accepted: January 31, 2011.
Published online: 2011 May, 30.
PII: S09747559INPE1000225-1
|
Objectives: To identify important factors (linked to lifestyle,
eating and sedentary behaviors) relating to waist circumference among
urban South Indian children aged 3 to 16 years.
Design: Cross sectional.
Setting: Urban schools of Bangalore, from August
2008 to January 2010.
Participants: 8444 children; 4707 children aged
3-10 years and 3737 children aged 10-16 years.
Methods: Data were collected on the frequency of
consumption of certain foods, physical activity patterns, sedentary
habits at home, sleep duration and behaviors such as habits of snacking,
skipping breakfast, eating in front of television and frequency of
eating out. Simple linear regression analysis of waist circumference on
various food items, physical activity, behavior and parental BMI were
performed. A path model was developed to identify potential causal
pathways to increase in waist circumference.
Results: Increased consumption of bakery items,
non vegetarian foods, increased television viewing, decreased sleep
duration, eating while watching television, snacking between meals,
family meals, skipping breakfast (in older children), and parental BMI
were found to be related to waist circumference. Older children possibly
under-reported their intake of "unhealthy" foods, but not behaviors.
Conclusions: This study identified potential
behaviors related to waist circumference in urban school children in
India. Longitudinal studies with better measures of morbidity and
adiposity are warranted in order to derive casual relationships between
various determinants and waist circumference.
Key words: Behavior, Determinants, Obesity, Waist
circumference.
|
|
Body mass index (BMI) is usually recommended for
identifying overweight or obese children and youth [1]. It is a measure
of excess weight relative to height rather than excess body fat and may
be a less sensitive indicator of fatness among children [2]. In our
previous study [3], where we derived waist percentile curves for
children aged 3 to 16 years, it was observed that greater than 50% of
the children were overweight and obese when compared to UK based
standards of waist circumference [4], while about 20% were
overweight/obese when the BMI based standards were used [5]. Further,
the waist circumference has been validated as a useful predictor for
cardiovascular disease risk factors in children [6]. Given the greater
prevalence of overweight by this standard, it might be more robust to
evaluate associated factors such as lifestyle behavior, food intake,
physical activity, and sleep as determinants of overweight.
Additionally, while the risk factors for increased BMI have been well
described, the relation between potential risk factors and waist
circumference is largely unknown.
The aim of the present study was to identify
potential factors (linked to lifestyle, eating and sedentary behaviors)
related to waist circumference among urban South Indian children aged 3
to 16 years. We also chose to assess clustering of these factors in
order to understand which behavior cluster may be the most relevant to
target in childhood obesity.
Methods
The study children were from the PEACH (Pediatric
Epidemiology and Child Health) study [3], conducted by St John’s
Research Institute, Bangalore. This cross sectional study was conducted
on children recruited from 8 urban middle income preschools and schools
in Bangalore from August 2008 to January 2010. The annual fees of the
schools that were chosen ranged from Rs. 24,000 to 30,000. The inclusion
criterion was normal healthy children in the age group of 3 to 16 years.
The exclusion criterion was a significant clinical history. The schools
were selected by using convenience sampling procedure for operational
feasibility. Anthropometric data was collected on 9060 children, while
the data on patterns of food consumption, physical activity and
behaviors related to foods intake was available for 8444 children;
4707children aged £10
years and 3737 children aged >10 years. Waist circumference values above
the 75th percentile cut-off [3] was used for classifying abdominal
obesity and the Khadilkar, et al. [5] cut-off for BMI was used to
define overweight/obesity.
Questionnaires: Information regarding the study
along with the consent sheet was sent to parents and socio-demographic
data (age, date of birth, sex, and history of medical illness, parental
education, occupation and income, height, weight) collected. The
reported monthly frequency of consumption of certain foods (chocolates,
sweets, ice creams, bakery items, cakes, soft drinks, fruit juices,
fried items, non vegetarian, vegetables, fruits and milk) was recorded.
Additionally, physical activity patterns, time spent in tuition after
school hours, sedentary habits at home (time spent in television
viewing, computer games and tuitions), time spent at games in school and
home, and duration of sleep were recorded. Information on certain
behaviors that could affect food intake such as habits of snacking,
skipping breakfast, eating in front of television, eating with the
family and the frequency of eating out was collected. In children 5th
grade and below, this questionnaire was filled by the parents. Children
of 6th grade and above filled these details themselves in class. The
questionnaire was pre-tested to ensure that both children and parents
understood the questions; however, it was not subjected to specific
validity and reliability tests. The institutional ethical review
committee approved the study and parental informed consent was obtained.
Anthropometry: Anthropometric measurements of
weight, height and waist circumference were measured by utilizing
standard methodology [7]. The body weight was measured to the nearest
0.1 kg using a calibrated electronic scale (Essae Teraoka Limited,
India). The height was measured to the nearest 0.1 cm. Waist
circumference was measured with a non-stretchable tape by trained
nutritionists (exerting the same standard pressure on the tape) at the
midpoint of the lowest rib cage and the iliac crest, to the nearest 0.1
cm [8], in a standing position during end-tidal expiration. The within
and between measurer coefficient of variation was 0.2% and 0.3%
respectively.
Statistical Methods: The weight and height of the
children (measured) and of parents (self reported) were used to
calculate their BMI. The intake of food items was recorded as frequency
consumed per day or week depending on the food item. These were later
converted into four class intervals of frequency of consumption based on
author’s knowledge of quantity of consumption and contribution of
calories, so that such that the children’s consumption could be graded
into low, low-normal, high-normal and high consumption frequencies
(Web
Table I). Game activities were assigned into three classes -
mild, moderate and vigorous, based on intensity of the activities and
their duration [9], yielding an intensity-duration construct called
‘games’. For sedentary activities and sleep, duration alone was used as
a continuous variable. The number of times the child skipped breakfast
in a month and other behaviors such as number of meals eaten with
family, snacking between meals, eating in front of television were also
used in the analyses.
Data are presented as mean (SD). All analyses were
performed separately for two age groups of
≤10 years (younger
children) and >10 years (older children), since the data for ≤10 years were filled
by parents, and for >10 years by the children themselves. Simple linear
regression analysis of waist circumference (WC) on various food items,
physical activity, behavior and parental BMI were performed to determine
significant predictors without any attempt to adjust for each other,
since the aim was to simply identify significant associations and is
presented in a bubble diagram. Path analysis is an efficient tool to
analyze realistic data where a given parameter may be an outcome with
respect to one variable but may in turn become a predictor for other
variable. To consider a possible causal mechanism of various factors
towards WC and to account for correlation between these determinants, a
hypothetic path model was developed. Food groups (Table I)
were used for this analysis. The variables that were significantly
associated with increase in waist circumference using simple linear
regression models were included in a path analysis. This method
facilitates the examination of direct and indirect relationships of the
various determinants on WC while accounting for co-variances between
them. The behavioral parameters were considered as exogenous variables
and therefore two of them being binary was permissible. Significant
mediating paths of behaviors through food intake were also included in
the model along with co-variances between the parameters. Direct paths
to WC and mediating paths that were statistically significant at 5%
level are represented in the path diagrams. To test the goodness of fit
of the model, RMSEA (root mean square error of approximation, 0.05 or
smaller) and Akaike index were used and the best model identified. All
analyses were performed using SPSS Version 17 (Chicago, Ill). Path
analysis was performed using the RAMONA module of SYSTAT Version 11.
TABLE II Groups of Food, Physical Activity and Behaviors Used in the Path Analysis
|
Variables |
Items |
|
Food |
Sweets: Bar/chocolate, Indian sweets, ice-cream |
|
Bakery: Cakes, Bun/Biscuits/ Bread/Puff |
|
Snacks/Fast food: Samosa, Chats, Potato chips, Mixtures,
Burger/pizza/noodles, Fast food |
|
Beverages: Fruit juice,Soft drink |
|
Non Vegetarian: Chicken, Mutton, Egg, Fish
|
|
Healthy items: Vegetables, Fruits, Milk |
|
Physical activity |
TV Viewing, Sleep, Games |
|
Behavior |
No. of meals with family, Snacking between meals, Eating in
front of television, Skipping breakfast |
|
Genetic |
Maternal BMI, Paternal BMI |
Results
Boys comprised 56% (n=2655) of younger
children, and 58% (n=2171) of the older children. The mean BMI
and WC of the children were 15.5± 2.1 kg/m 2
and 55.5±6.7 cm in the younger children and 18.0±3.4 kg/m2
and 68.6±9.2 cm in the older children, respectively. The correlation
coefficient between BMI and waist circumference was 0.72 (younger
children) and 0.81 (older children) with P<0.001. Using the
Khadilkar, et al. [5] cut-off, it was observed that 22% and 15%
of the children were overweight/obese among the younger and older
children, respectively.
The statistically significant regression coefficient
of individual food items, physical activity patterns, behaviors and
parental BMI, which contributed to increase in BMI (kg/m 2)
and WC (cm), are presented in Web Table II. Among the food
items, the consumption of chicken, fish, bakery items and fast foods
contributed to increase in BMI and WC in the younger children, and only
to WC in older children. With regard to physical activity; increased
duration of TV viewing and decreased duration of sleep contributed to
increase in BMI and WC in both the groups of children. Among the
behavior patterns, eating while watching TV and snacking between meals
increased WC in both age groups, while skipping breakfast increased WC
only in older children. Maternal BMI was a strong contributor of
increasing WC in both the groups. The factors that contributed to
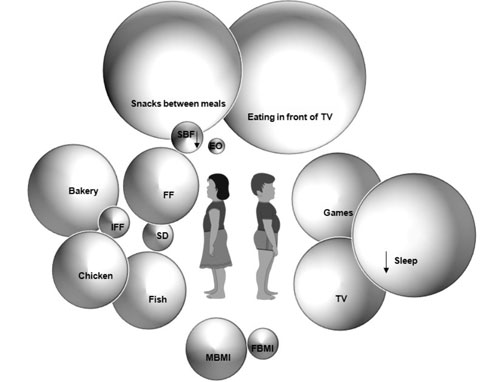
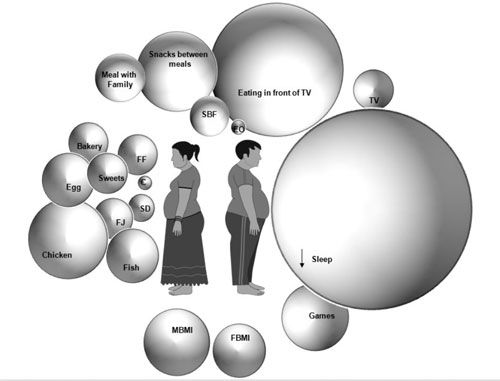
increase in WC are depicted in a bubble diagram (Fig. 1).
 |
|
Children <7 years
|
 |
|
Children ≥10
years
|
|
Fig.1 Factors related to increasing waist
circumference. The size of each bubble is proportional to the
regression coefficient of the particular predictor. FF- Fast
food, IFF- Indian Fast Food (Vada, Bhaji, Bonda), SD- Soft
drinks, FJ- Fruit Juice, EO- eating out, C- Chocolates, SBF-
Skip Breakfast, MBMI- Mother’s BMI, FBMI - Father’s BMI.
|
The path diagrams for the younger and older children
are presented in web Fig. 1. Among the younger children
there was a mediated effect of behaviors such as "number of eat-outs",
"snacks between meals" and "eating in front of TV" through increase
consumption of snacks/fried foods, bakery and non-vegetarian, on an
increase in WC. In addition, increased consumption of healthy foods also
increased WC, suggesting that in this age group irrespective of the kind
of food item (healthy/unhealthy), increased intake was associated with
increased waist circumference. Increased frequency of skipping breakfast
and duration of sleeping had a negative effect on WC, increased physical
activity and parental BMI had positive effects on WC.
Among older children, there were significant positive
effects of behaviors on consumption of food, but among food only the
increased consumption of non-vegetarian items showed a significant
effect on WC. Further examination of the data to understand the absence
of these relationships showed that, the intake of all food items
reported by this age group children who were above the 75th percentile
cut-off for abdominal obesity [3], were significantly lower (P<0.05)
than those reported by children below this cut-off. Increased frequency
of "eating in front of TV" had a strong positive effect on WC, while
"meals with family without watching TV" had a negative effect on WC. The
duration of sleep had a strong negative effect on WC, while parental BMI
had a positive effect.
Discussion
The present study aimed at looking at the potential
self reported behavioral factors related to WC in urban school children.
While, it is possible that several behaviors could be related to one
another, we chose initially to present each behavior individually, to
provide a sense of the diversity of drivers of waist circumference in a
child’s world. We used this initial approach since other analytical
strategies (such as the path analysis), which assess correlations
between different factors, would inevitably identify only one out of
several interrelated factors. However, we also used path analysis to
obtain possible casual mechanisms towards WC and to account for
correlation between these determinants. This showed that in the older
children, there was a relationship between some eating behaviors and
actual foods consumed, but no subsequent path from foods to WC except
for non-vegetarian foods, even though a direct link between some
behaviors and WC was evident. This suggests that children are likely to
underreport their food intake, and this is perhaps because of the often
intense messages they receive about the dangers of eating
inappropriately. However, they are not yet aware of the effect of their
behaviors or have not yet been educated intensively about them.
Therefore, focus on behaviors and foods, rather than foods alone,
offers an opportunity to plan better surveillance or interventions. The
biggest factors shown in the bubble diagram (Fig. 1) were
in agreement with previous studies based on BMI [9-11].
This study also highlights the relationship of
important negative behaviors of eating while watching TV, snacking
between meals and regular eating out on WC, while a protective effect of
family meals without TV was observed; as also observed earlier [12-14].
Skipping of breakfast in the older children was associated with
increased WC, which was consistent with earlier studies [15].
Decreased sleep duration was strongly related to WC,
and is likely to be due to homework, tuitions and TV viewing in older
children. Short sleep duration has shown to be a risk factor for obesity
in children through modulation of hormones such as leptin and ghrelin
[16]. In the younger children it was observed that increased physical
activity was associated with increased waist circumference. Increased
physical activity, may not in fact translate to total energy expenditure
being greater, since we did not measure the actual intensity of exercise
physically (there could be variable amounts of time spent being still,
even when ‘playing games’. This may have been more marked in the
unstructured games in the younger age group. Further, this was reported
by the parent- there may have been errors in the reportage. To resolve
this would need nested studies with measurements of physical activity.
In addition to the behaviors, parental BMI, especially maternal BMI
which is a known risk factor for childhood obesity [17] was a
significant contributor to increased WC in the present study. This
association likely reflects the clustering of risk behaviors in families
and genetic factors that affect obesity. To our knowledge, no Indian
study has previously examined the associations between parental
overweight and WC in children and adolescents.
In conclusion, while the present study identified
certain factors related to increased WC in urban Indian school children,
it highlighted the necessity of structuring dietary intake
questionnaires in such a way, that questions do not arouse the anxiety
to report what is deemed to be ‘healthy’. It also emphasizes capturing
information on behaviors that are not campaigned as risk factors of
obesity. The limitation of this cross sectional study was that while
hypotheses could be generated, determinants of WC could not be
ascertained and we also could not measure body fat or morbidity.
Additionally, the questionnaires used in this study were not validated.
These issues can be better evaluated by future longitudinal studies
using validated questionnaires attributing lifestyle change to better
measures of adiposity such as body fat.
Acknowledgment: Mr Lazar for help in data
collection.
Contributors: RK conceived and designed the
study, interpreted the data and wrote the manuscript. TT and SS
conducted the statistical analysis. DPL, NRS and RJ collected the data
and helped in drafting the manuscript. SB was involved in reviewing the
results and manuscript. AVK was involved in the design of the study,
interpretation of the data and revised the manuscript for important
intellectual content. He will act as the guarantor of the study. The
final manuscript was approved by all the authors.
Funding: None; Competing interests: None
stated.
References
1. Cole TJ, Bellizzi MC, Flegal KM, Dietz WH.
Establishing a standard definition for child overweight and obesity
worldwide: international survey. BMJ. 2000;320:1240-3.
2. Reilly JJ, Dorosty AR, Emmett PM, Avon
Longitudinal Study of Pregnancy and Childhood Study Team. Identification
of the obese child: adequacy of the body mass index for clinical
practice and epidemiology. Int J Obes Relat Metab Disord.
2000;24:1623-7.
3. Kuriyan R, Thomas T, Lokesh DP, Sheth NR, Mahendra
A, Joy R. et al. Waist circumference and waist for height
percentiles in urban South Indian children aged 3-16 years. Indian
Pediatr. 2011;48:765-71.
4. McCarthy HD, Jarrett KV, Crawley HF. The
development of waist circumference percentiles in British children aged
5.0-16.9 y. Eur J Clin Nutr. 2001;55:902-7.
5. Khadilkar VV, Khadilkar AV, Choudhury P, Agarwal
KN, Ugra D, Shah NK. IAP Growth Monitoring Guidelines for children from
birth to 18 years. Indian Pediatr. 2007;44:187-97.
6. Freedman DS, Serdula MK, Srinivasan SR, Berenson
GS. Relation of circumferences and skinfold thicknesses to lipid and
insulin concentrations in children and adolescents: The Bogalusa Heart
Study. Am J Clin Nutr. 1999;69:308-17.
7. Harrison GG, Buskirk ER, Carter JEL, Johnston FE,
Lohman TG, Pollock ML, et al. Skinfold thickness and measurement
technique. In: Lohman TG, Roche AF, Martorell R, editors.
Anthropometric Standardization Reference Manual. Illinois: Human
Kinetics Book; 1988. p. 55-71.
8. World Health Organisation. Physical status: the
use and interpretation of anthropometry: a report of a WHO expert
committee. Geneva: WHO; 1995.
9. Ainsworth BE, Haskell WL, Whitt MC, Irwin ML,
Swartz AM, Strath SJ, et al. Compendium of physical activities:
an update of activity codes and MET intensities. Med Sci Sports Exerc.
2000;32 (Suppl 9):S498-S504.
10. Taveras EM, Berkey CS, Rifas-Shiman SL, Ludwig
DS, Rockett HR, Field AE, et al. Association of consumption of
fried food away from home with body mass index and diet quality in older
children and adolescents. Pediatrics. 2005;116:e518-24.
11. Shin KO, Oh SY, Park HS. Empirically derived
major dietary patterns and their associations with overweight in Korean
preschool children. Br J Nutr. 2007;98:416-21.
12. Singh R, Martin BR, Hickey Y, Teegarden D,
Campbell WW, Craig BA, et al. Comparison of self-reported,
measured, metabolizable energy intake with total energy expenditure in
overweight teens. Am J Clin Nutr. 2009;89:1744-50.
13. Veugelers PJ, Fitzgerald AL. Prevalence of and
risk factors for childhood overweight and obesity. CMAJ.
2005;173:607-13.
14. Yuasa K, Sei M, Takeda E, Ewis AA, Munakata H,
Onishi C, et al. Effects of lifestyle habits and eating meals
together with the family on the prevalence of obesity among school
children in Tokushima, Japan: a cross-sectional questionnaire-based
survey. J Med Invest. 2008;55:71-7.
15. Roblin L. Childhood obesity: food, nutrient, and
eating-habit trends and influences. Appl Physiol Nutr Metab.
2007;32:635-45.
16. Halford JC, Gillespie J, Brown V, Pontin EE,
Dovey TM. Effect of television advertisements for foods on food
consumption in children. Appetite. 2004;42:221-5.
17. Agras WS, Hammer LD, McNicholas F, Kraemer HC. Risk factors for
childhood overweight: a prospective study from birth to 9.5 years. J
Pediatr. 2004;145:20-25.
|
|
|
 |
|
