|
|
|
Indian Pediatr 2020;57: 904-906 |
 |
Body Mass Index Quick Screening Tool for
Indian Academy of Pediatrics 2015 Growth Charts
|
|
Vaman Khadilkar, Nikhil Lohiya, Shashi Chiplonkar and
Anuradha Khadilkar
From Department of Growth and Pediatric Endocrine,
Hirabai Cowasji Jehangir Medical Research Institute,
Jehangir Hospital, Pune, Maharashtra, India.
Correspondence to: Dr Anuradha Khadilkar, Hirabai Cowasji
Jehangir Medical Research Institute, Jehangir Hospital, Pune,
Maharasthra, India.
Email:
[email protected]
Submitted: April 25, 2019;
Initial review: July 29, 2019;
Accepted: April 7, 2020.
Published online: June 12, 2020;
PII: S097475591600197
|
|
Objective: To develop
gender-specific graphic tool in which BMI cut offs can be read
from height and weight, without need for calculating BMI and to
validate the tool against Indian Academy of Pediatrics (IAP)
2015 BMI charts. Methods: Validation of tool was
performed using de-identified data on children from school
health surveys. Results: For detection of overweight and
obesity, the BMI tool had sensitivity of 95.7% and specificity
of 85.7% for boys, and 95.7% and 89.7% for girls, respectively.
For underweight, sensitivity of 100% for boys and girls, and
specificity of 88.9% for boys and 82.4% for girls was observed.
Conclusion: We present a graphic BMI tool for screening
for underweight, overweight and obesity, which complements the
existing IAP charts.
Keywords: Diagnosis, Growth chart,
Obesity, Overweight, Underweight.
|
I
n recent times, while undernutrition
is common in India [1], childhood obesity is an important
health problem in urban areas, and seen commonly in older
children and adolescents than younger children [2]. Early
recognition of obesity is important to prevent adverse
health consequences in adulthood such as hypertension and
type 2 diabetes [3]. Further, under-nutrition during
adolescence can potentially retard adole-scent growth spurt
[4]. Indian Academy of Pediatrics (IAP) Guidelines provide
body mass index (BMI) charts for Indian children to screen
for under or over-nutrition [5]. BMI needs to be computed
and then plotted on a growth chart. However, in a busy
pediatric out-patient clinic, calculating BMI is time
consuming and is often omitted [6]. BMI may not be plotted
and hence over-weight and underweight may be missed. Thus,
there is a need to create a screening tool based on height
and weight that eliminates need for BMI calculation and
helps pediatricians rapidly screen for overweight, obesity
and underweight. The objective of present study was to
develop a gender-specific graphic tool in which BMI cut offs
can be read from height on X-axis and weight on Y-axis,
without the need to calculate BMI.
METHODS
The health-related risks of obesity such
as metabolic syndrome are more common after 10 years of age
or at the onset of puberty and likewise recommendations for
screening for metabolic syndrome [7-9]. We therefore
designed the BMI tool for use from 8 years. The mean value
of height, weight and cut-offs for underweight, overweight
and obesity were used from the IAP charts [5] to design the
tool. Ethics approval for the study was obtained from the
institutional ethics committee. The height range for boys
and girls for the age group of 8-18 years was plotted on the
X-axis. Based on the BMI cut off value for that
particular age the corresponding weight to a particular
height was calculated and plotted on the secondary Y-axis
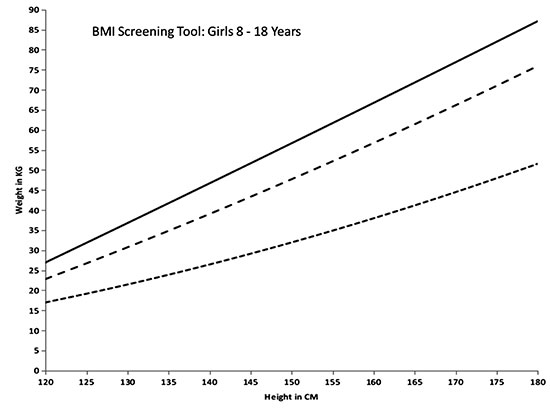
(Microsoft Excel 2015). Thus, height was plotted on the X-axis,
weight on the Y-axis and three lines viz, for
underweight, overweight and obesity were constructed on
secondary Y-axis. The meeting point of the two lines
gives the BMI. Depending on where the BMI point lies, child
may be classified as being, obese, overweight, normal weight
or underweight. If plotted reading falls below lowest line
the child is underweight, if it is between underweight and
overweight lines, the child has a BMI within reference
range, if the reading falls between overweight and obese
lines the child is over-weight, and if above obese line, the
child is considered obese. Separate tools were created for
both genders.
Sample size was calculated using external
prognostic modeling [10] and was recommended to be more than
200. The tool was validated on de-identified data from a
health survey [11]. Data were distributed over BMI
categories as per the IAP charts into underweight, within
reference range, overweight and obese, and used to test
sensitivity and specificity of BMI tool. Data on height and
weight from validation data set were plotted on BMI tool and
simultaneously on the IAP BMI charts. The number of children
classified as underweight, within reference range,
overweight and obese by the tool and IAP charts was noted.
Sensitivity and specificity of the tool against IAP charts
was computed (SPSS 25).
RESULTS
Data on 221 (112 boys) children age 8-18
years were used. The gender-wise BMI screening tools are
illustrated in Fig. 1 and 2.
 |
|
Fig. 1 Body mass
index screening tool for girls aged 8-18 years.
|
 |
|
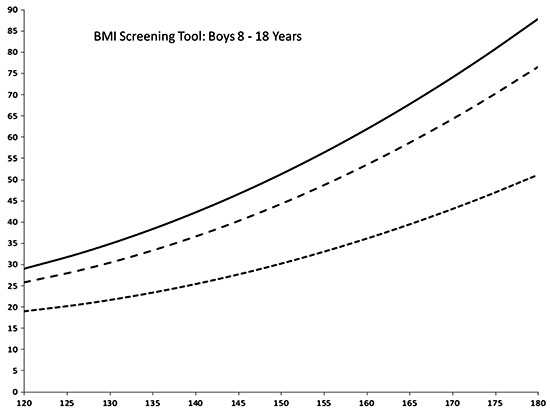
Fig. 2 Body mass
index screening tool for boys aged 8-18 years.
|
For detection of overweight and obesity
in comparison with IAP charts, sensitivity was 95.7% for
both boys and girls, whereas specificity was 85.7% for girls
and 89.7% for boys. For detection of underweight,
sensitivity was 100% for both genders and specificity was
88.9% for boys and 82.4% for girls.
DISCUSSION
We have presented a graphic tool based on
IAP growth charts in which BMI can be read by plotting
height and weight without the need to calculate BMI. The
tool demonstrated high sensitivity and specificity for
screen-ing children for underweight, overweight and obesity,
when tested against IAP BMI charts.
The limitations of the tool are that it
is likely to categorize children wrongly at extreme ends of
height for age, thus, too tall and very short children may
be wrongly classified. The tool cannot be used in children
younger than 8 years, and larger studies with a bigger
sample size are required for validation and generalization
of the tool.
In a study where questionnaires were sent
to Ministries of Health of 202 countries, authors found that
growth charts were mainly used for children from 0-5 years,
and covered birth to adolescence in only 29% [12]. More than
half of the countries, including 18 Asian countries, used
weight for age charts instead of BMI charts [17]. In a
questionnaire-based study to assess usage of growth charts,
over two-third of doctors reported a positive attitude
towards monitoring of growth; how-ever, perception of high
workload was associated with lower usage of growth charts
[8]. There are fewer preventive visits to hospitals as
children get older [13]. These reports thus underline the
importance of devising simple graphic tools to assess
nutritional status for use in busy clinical settings.
A similar unisex chart was proposed by
Elizabeth, et al. [14] in 2001 based on the
International Obesity Task Force cut-offs [15], which may
not be appropriate for Indian children at present. Unisex
charts may not be appropriate as girls stop growing earlier
than boys. The tool designed in the current study may be
used in con-junction with IAP charts, and the cut-offs for
BMI used are more appropriate for Asian Indian children, who
have a higher body fat for a given BMI. However, it is
important to remember that this is a quick screening tool
and children who are found to be abnormal on the tool or at
borderline of categories should be rechecked on the IAP BMI
charts after calculating the BMI with standard formula.
To conclude, we present a graphic BMI
tool for screening for underweight, overweight and obesity
to complement existing IAP charts. The tool is gender
specific and is based on height and weight, which eliminates
the need for calculation of BMI, and may help pediatricians
to rapidly screen for perturbations in BMI in a busy
clinical setting.
Ethics clearance:
Institutional ethic committee of Jehangir Clinical
Development Centre; dated June 21, 2016.
Contributors: VK:
concept and design of study, statistical analysis and
manuscript draft; NL, SC, AK: data collection, statistical
analysis and manuscript draft.
Funding: None;
Competing interest: None stated.
|
What This Study Adds?
A body mass index (BMI) look-up tool using height
and weight has been presented for screening for
overweight, obesity and underweight in children aged
between 8 and18 years.
|
REFERENCES
1. NCD Risk Factor Collaboration.
Worldwide trends in body-mass index, underweight,
overweight, and obesity from 1975 to 2016: A pooled analysis
of 2416 population-based measurement studies in 128.9
million children, adolescents, and adults. Lancet.
2017;390:2627-42.
2. Ranjani H, Mehreen TS, Pradeepa R,
Anjana RM, Garg R, Anand K, et al. Epidemiology of
childhood overweight and obesity in India:vA systematic
review. Indian J Med Res. 2016;143:160-74.
3. Liang Y, Hou D, Zhao X, Wang L, Hu Y,
Liu J, et al. Child-hood obesity affects adult
metabolic syndrome and diabetes. Endocrine. 2015;50:87-92.
4. Dasgupta A, Butt A, Saha TK, Basu G,
Chattopadhyay A, Mukherjee A. Assessment of malnutrition
among adole-scents: Can BMI be replaced by MUAC. Indian J
Community Med. 2010;35:276-9.
5. Indian Academy of Pediatrics Growth
Charts Committee. Khadilkar V, Yadav S, Agrawal KK, Tamboli
S, Banerjee M, Cherian A, et al. Revised IAP growth
charts for height, weight and body mass index for 5- to
18-year-old Indian children. Indian Pediatr. 2015;52:47-55.
6. Smith S, Reji E. Doctor’s attitudes to
and knowledge and usage of growth charts. S Afr Fam Pract.
2015;57:219-22.
7. Barlow SE, the Expert Committee.
Expert committee recommendations regarding the prevention,
assessment, and treatment of child and adolescent overweight
and obesity: Summary report. Pediatrics. 2007;120:S164-92.
8. Expert Panel on Integrated Guidelines
for Cardiovascular Health and Risk Reduction in Children and
Adolescents; National Heart, Lung, and Blood Institute.
Expert panel on integrated guidelines for cardiovascular
health and risk reduction in children and adolescents:
Summary report. Pediatrics. 2011;128:S213-56.
9. Zimmet P, Alberti KG, Kaufman F,
Tajima N, Silink M, Arslanian S, et al; IDF Consensus
Group. The metabolic syndrome in children and adolescents -
an IDF consensus report. Pediatr Diabetes. 2007;8:299-306.
10. Collins GS, Ogundimu EO, Altman DG.
Sample size considerations for the external validation of a
multivariable prognostic model: A resampling study. Stat
Med. 2016; 35:214-26.
11. Lohiya N, Khadilkar V, Pawar S,
Khadilkar A, Chiplonkar S, Jahagirdar R. Field testing IAP
2015 charts. Indian J Pediatr. 2018;85:723-8.
12. de Onis M, Wijnhoven TMA, Onyango AW.
Worldwide practices in child growth monitoring. J Pediatr.
2004;144: 4610-5.
13. Almeida AC, Mendes LC, Sada IR, Ramos
EG, Fonseca VM, Peixoto MV. Use of a monitoring tool for
growth and development in Brazilian children: Systematic
literature review. Rev Paul Pediatr. 2016;34:122-31.
14. Elizabeth KE. A novel growth
assessment chart for adolescent. Indian Pediatr. 2001;
38:1061-4.
15. Cole TJ, Bellizzi MC, Flegal KM, Dietz WH.
Establishing a standard definition for child overweight and
obesity worldwide: International survey. BMJ.
2000;320:1240-3.
|
|
|
 |
|
