|
|
|
Indian Pediatr 2015;52:
857-863 |
 |
Association of
Perceived Weight Status versus Body Mass Index on
Adherence to Weight-modifying plan Among Iranian Children and
Adolescents: The CASPIAN-IV Study
|
|
# Maryam Bahreynian,
$@Mostafa Qorbani,
‡Mohammad Esmaeil Motlagh,
@Ramin Heshmat,
*Gelayol Ardalan and *Roya Kelishadi
From the Departments of *Pediatrics, #Nutrition
Department, Child Growth and Development Research Center, Research
Institute for Primordial Prevention of Non-communicable Disease, Isfahan
University of Medical Sciences, Isfahan; and $Community
Medicine, Alborz University of Medical Sciences, Karaj; @Chronic
Diseases Research Center, Endocrinology and Metabolism Population
Sciences Institute, Tehran University of Medical Sciences, Tehran; and
‡Pediatrics, Ahvaz Jundishapur University of Medical
Sciences, Ahvaz; Iran.
Correspondence to: Dr Roya Kelishadi, Department of
Pediatrics, Child Growth and Development Research Center, Research
Institute for Primordial Prevention of Non-communicable Disease, Isfahan
University of Medical Sciences, Isfahan, Iran.
Email: [email protected]
Received: September 23, 2014;
Initial review: November 24, 2014;
Accepted; July 30, 2015.
|
Objective: To identify risk-groups adhering to weight-changing plans
for body dissatisfaction in a National sample of Iranian students.
Design: Cross-sectional.
Setting: Primary, Middle and high-schools.
Participants: 13486 students (mean age, 12.5 y).
Main outcome measures: Demographic and
anthropometric characteristics were collected via valid
instruments. Body image and adherence to weight- changing diets were
assessed by using validated questionnaires.
Results: 46.5% students were satisfied with their
weight and12.5% declared that they had attempts for weight control, this
was significantly higher among adolescent girls (13.8%, P=0.0005).
Participants who perceived themselves as overweight and obese, were more
likely (OR= 5.32) to follow weight-reduction diets than their peers with
normal-weight perception. Actual overweight-BMI and obese-BMI
individuals had greater odds for being on a diet (1.3 and 1.47,
respectively) compared to their normal-BMI counterparts.
Conclusion: Promoting strategies to improve body
image concerns and prevent adverse outcomes of chronic dieting among
adolescents are necessary.
Keywords: Body image, weight perception, body dissatisfaction,
adolescents, weight reduction diet.
|
|
Body image refers to a multi-component concept
including different aspects of perceptions, cognitions and feelings, as
well as behavioral practices related to individual’s own body [1].
Self-esteem and psycho-social development of individuals are affected by
body image as a part of one’s personality [2]. Previous research has
indicated that teenagers are the vulnerable target group for development
of body dissatisfaction due to the considerable physical and
psychological changes [3]. Overweight and obese adolescents tend to be
less satisfied with their body weight compared to under- and
normal-weight counterparts [4]. This is more prevalent among adolescent
girls, who are at greater risk of body dissatisfaction due to the
exposure of extreme slimness and media images [5].
Perceived weight and body image disturbance
contribute to weight-control practices. Unhealthy weight-control
behaviors such as following restricted diets, binge-eating, provocating
vomiting, and changing physical activity levels are considered as an
approach to achieve more favorable body shape and satisfaction [6].
Although fatness is accepted as a part of cultural norms reflecting a
greater degree of health, affluence and fertility among females than
males [7], recent research has indicated higher desire of extremely-thin
body shape in young females [8].
Although few studies have assessed the prevalence of
body-dissatisfaction and related weight-control behaviors in the
pediatric age group, limited data are available from developing
countries [9]. This study was conducted to determine the association of
perceived weight versus actual body weight on adherence to weight
modifying plan among a representative sample of Iranian children and
adolescents.
Methods
A cross-sectional school-based survey was conducted
in 2011-2012 among a Nationally representative sample of Iranian
children and adolescents. Data from the fourth part of Childhood
Adolescence Surveillance and Prevention of Adult Non-communicable
disease (CASPIAN) were used for the current study.
The CASPIAN-IV survey was conducted on a stratified
multi-stage probability sample of Iranian children and adolescents from
urban and rural area of 30 provinces. The study protocopl has been
published previously [10]. In total, 13486 students participated in this
study. The present study was approved by the ethical committees of
relevant national organizations. Parental consent form and verbal assent
showing willingness of child were obtained for participation in this
study.
Socio-demographic characteristics and physical
examination including height, weight, and waist-circumference were
collected using standard protocols [10] by trained healthcare
professionals. Body mass index (BMI) was then calculated by division of
weight in kilograms to height in squared meters. Interview-based
questionnaires used for this project showed a relatively high
reliability (Pearson correlation coefficient of the test-retest phase
was 0.94), and face and content validity (score >0.75) [11,12] before
administration in the current study. The questionnaires were designed
based on the Global School-based Health Survey (GSHS) proposed by World
Health Organization (WHO), including questions about health risk
behaviors, communication with friends, dietary intakes and food
behaviors, other life-style factors and so on. Modification of some
items was applied according to Iranian socio-culture amileu status.
Previous experience of being on a diet to modify weight status was asked
by a question added to the main body of the questionnaire. All
interviews were done in a calm and friendly atmosphere [12].
We measured body satisfaction using the question
"What do you think regarding your body size?"; with a five-point likest
scale answers including ‘much too thin’, a bit too thin, ‘about the
right size’, ‘a bit too fat’, ‘much too fat’. For the analysis, the
variable was dichotomized into underweight (a bit too thin and much too
thin), overweight (a bit too fat and much too fat) versus normal
weight perception. Any previous attempts to change body weight and
following weight-modifying diets were assessed with a four-scale
question consisting "No; My weight is normal, yes; I need to lose
weight, yes; I need to gain weight, yes".
Socio-demographic characteristics of study
participants were classified as a combination of parental educational
level and occupation, having own computer and car, housing type (rented
vs. personal) using principal component analysis (PCA).
Overweight (BMI between 85 th
and 95th percentiles for age
and sex) and obesity (BMI greater than 95th
percentile) were defined according to the WHO reference
curves [13]. Abdominal adiposity was determined by the ratio of
waist-to-height more than 0.5 [14].
Statistical analysis: All analysis was performed
using STATA package. The odds of adherence to weight-reduction plan were
determined using multivariate logistic regression models according to
BMI and perceived weight, controlling for potential covariates such as
age, gender, physical activity, obesity, socio-economic status, and
screen time activities in different models. In Model I, as a crude
model, the association between BMI (perceived weight) and adherence to
weight-reduction plan was assessed. Model II was adjusted for
potentional covariates Normal-weight was considered as the reference
category. P value less than 0.05 was considered as the
significant.
Results
We enrolled 13486 school students with the mean age
of 12.47 years (95% CI: 12.40, 12.54) (49.2% girls, 75.6% urban). More
than 90% of students were from the public schools. Mean (95% CI) BMI and
waist circumference were 18.8 (18.74, 18.95) kg/m 2
and 67.1 (66.77, 67.42) cm, respectively.
Overall, 9.5 and 12% of participants were classified
as overweight and obese, respectively. In total, 46.5% of students were
satisfied with their weight, showing significant gender differences (49%
vs. 44.11% in boys and girls, respectively, P<0.001).
Among study participants, 12.5% of students declared that they were on a
diet to lose weight, this figure was significantly higher among
adolescent girls compare to boys (13.81% vs. 11.2%, P=0.0005).
The demographic, anthropometric characteristics and following
weight-reduction plans of study participants are presented in
Table I.
TABLE I Anthropometric and Demographic Characteristics of Subjects According to Sex: The CASPIAN-IV Study
|
Boys |
Girls |
Total |
P value |
|
Age (y)1 |
12.4 (12.18,12.54) |
12.6 (12.40,12.79) |
12.5 (12.40,12.54) |
0.20 |
|
BMI (Kg/m2)1 |
18.7 (18.56, 18.91) |
18.9 (18.78, 19.13) |
18.8 (18.74, 18.95) |
0.1 |
|
WC (cm)1 |
67.9 (67.31, 68.47) |
66.3 (65.79, 66.76) |
67.1 (66.77, 67.42) |
<0.001 |
|
Screen time activity2 |
|
|
|
|
|
£2 h/day |
5799 (87.73) |
6021 (93.06) |
11820 (90.37) |
<0.001 |
|
>2h/day |
811 (12.27) |
449 (6.94) |
1260 (9.63) |
|
|
Physical activity |
|
|
|
|
|
<2 times/week |
1945 (28.75) |
2608 (39.61) |
4553 (34.11) |
|
|
2-4 times/week |
2410 (35.62) |
2500 (37.97) |
4910 (36.78) |
<0.001 |
|
>4 times/week |
2410 (35.62) |
1476 (22.42) |
3886 (29.11) |
|
|
Socio-economic status (SES)2 |
|
|
|
|
|
Poor |
2082 (33.18) |
2065 (33.77) |
4147 (33.47) |
|
|
Moderate |
2050 (32.67) |
2050 (33.52) |
4100 (33.09) |
0.571 |
|
Good |
2143 (34.15) |
2000 (32.71) |
4143 (33.44) |
|
|
BMI (kg/m²) |
|
|
|
|
|
Underweight |
881 (13.03) |
740 (11.28) |
1621 (12.17) |
|
|
About right |
4333 (64.11) |
4497 (68.52) |
8830 (66.28) |
<0.001 |
|
Overweight |
627 (9.28) |
660 (10.06) |
1287 (9.66) |
|
|
Obese |
918 (13.58) |
666 (10.15) |
1584 (11.89) |
|
|
Perceived weight status |
|
|
|
|
|
Underweight |
2335 (34.24) |
2261 (34.19) |
4596 (34.21) |
|
|
About right |
3342 (49.00) |
2917 (44.11) |
6259 (46.59) |
<0.001 |
|
Overweight |
1143 (16.76) |
1435 (21.70) |
2578 (19.19) |
|
|
BMI-Perceived weight status |
|
|
|
|
|
Healthy weight-underweight |
308 (4.57) |
195 (2.98) |
503 (3.79) |
|
|
Healthy weight-about right |
2401 (35.65) |
2310 (35.33) |
4711 (35.49) |
|
|
Healthy weight-overweight |
598 (8.88) |
385 (5.89) |
983 (7.41) |
|
|
Underweight-underweight |
543 (8.06) |
531 (8.12) |
1074 (8.09) |
<0.001 |
|
Underweight-about right |
1606 (23.85) |
1577 (24.12) |
3183 (23.98) |
|
|
Underweight-overweight |
153 (2.27) |
117 (1.79) |
270 (2.03) |
|
|
Overweight-underweight |
26 (0.39) |
14 (0.21 |
40 (0.30) |
|
|
Overweight-about right |
311 (4.62) |
596 (9.11) |
907 (6.83) |
|
|
Overweight-overweight |
789 (11.71) |
814 (12.45) |
1603 (12.08) |
|
|
HTN; Hypertension, DM; Diabetes mellitus , BMI; body mass
index, WC; waist circumference, WHtR; waist-to-height ratio,
SES; Socio-economic status; 1Continuous variable are as mean
(95%CI); 2SES categories based on PCA, consisted of parental
educational level and occupation, having own computer and car,
and housing type (rented vs. personal). |
 |
|
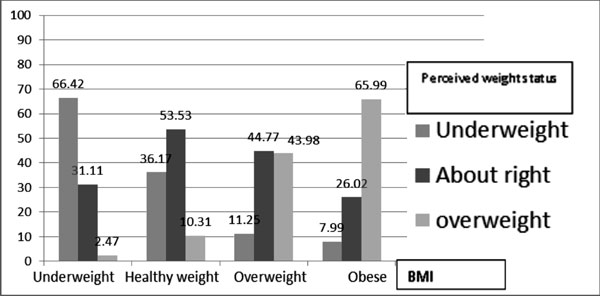
Fig. 1 Association between BMI and
perceived weight status among Iranian students.
|
Fig. 1 demonstrates association between BMI
and perceived weight status. Overall, 53.5% of healthy-weight
adolescents perceived their weight accurately as about right; this
figure was higher among obese-BMI students (66%) who correctly perceived
themselves as overweight and 66.4% of underweight adolescents who
estimated their weight perception accurately as underweight.
TABLE II 	Comparison of Body Image, Actual Body Mass Index and Abdominal Obesity According to Adherence to
a Weight Changing Plan: The CASPIAN-IV Study Adherence to Weight Changing Plan Based on A Special Diet
|
Variables |
No |
Yes |
P-value |
|
BMI (Kg/m2)1 |
18.54 (18.44, 18.64) |
20.96 (20.65, 21.26) |
<0.001 |
|
WC (cm)1 |
66.31 (65.98, 66.63) |
72.63 (71.82, 73.44) |
<0.001 |
|
BMI2 |
|
|
|
|
Underweight |
1433 (12.34) |
182 (10.95) |
<0.001 |
|
Normal weight |
7944 (68.42) |
859 (51.68) |
|
|
Overweight |
1042 (8.97) |
237 (14.26) |
|
|
Obese |
1192 (10.27) |
384 (23.10) |
|
|
Abdominal obesity2 |
|
|
|
|
Yes |
1984 (17.03) |
555 (33.27) |
<0.001 |
|
No |
9666 (82.97) |
1113 (66.73) |
|
|
Perceived weight status2 |
|
|
|
|
Underweight |
4036 (34.36) |
554 (33.04) |
<0.001 |
|
About right |
5882 (50.07) |
374 (22.30) |
|
|
Overweight |
1829 (15.57) |
479 (44.66) |
|
|
BMI-Perceived weight status2 |
|
|
|
|
Healthy weight-underweight |
476 (4.10) |
26 (1.56) |
<0.001 |
|
Healthy weight-about right |
4459 (38.43) |
250 (15.04) |
|
|
Healthy weight-overweight |
886 (7.64) |
97 (5.84) |
|
|
Underweight-underweight |
920 (7.93) |
152 (9.15) |
|
|
Underweight-about right |
2811 (24.23) |
369 (22.20) |
|
|
Underweight-overweight |
244 (2.10) |
25 (1.50) |
|
|
Overweight/obese-underweight |
36 (0.31) |
4 (0.24) |
|
|
Overweight/obese -about right |
667 (5.75) |
240 (14.44) |
|
|
Overweight/obese - overweight |
1104 (9.51) |
499 (30.02) |
|
|
Congruent BMI-Perceived weight status2 |
|
|
|
|
Yes |
6483 (55.87) |
901 (54.21) |
0.232 |
|
No |
5120 (44.13) |
761 (45.79) |
|
|
1Continuous variable are as mean (95% CI); 2Categorical
variables are as numbers (N) and percentages. |
Table II compares the body image, actual body
mass index and abdominal obesity according to adherence to weight
changing plan. By measured BMI, the prevalence of subjects adhering to a
weight-reduction plan was 14.3% and 23.1%, among overweight and obese
individuals, respectively, with significant differences between actual
body mass index categories (P<0.001).
Thirty-three percent of abdominally obese adolescents
were on a weight reduction diet. However, adolescents who perceived
themselves as underweight (33.0%) or overweight (44.7%), were more
likely to follow weight reduction plans compared to their about-right
(22.3%) weight perception peers.
When we combined actual BMI and perceived weight
status, the highest rate (30.0%) of following weight reduction diets was
observed among overweight and obese adolescents who had correctly
perceived themselves as overweight subjects. This figure was 14.4% in
those students who were actually overweight or obese, but perceived
their weight as about right subjects. Fifteen percent of students who
tried diets to change their weight were healthy-weight teens, who
perceived themselves as about right and 22% of students who tried diets
to change their weight were underweight students with about right weight
perception. Congruent BMI- perceived weight revealed that 54.2% of
students had tried dietary practices to control their weight.
TABLE III Adherence to Weight-Changing Plan According to Perceived Weight-Status, BMI and Gender BMI
|
Perceived weight status |
Underweight |
Normal weight |
Overweight |
Obese |
Total |
P-value |
|
Boys |
Underweight |
542 (12.36) |
1604 (11.97) |
78 (8.9) |
74 (9.4) |
2298 (11.87) |
0.759 |
|
About right |
307 (4.5) |
2400 (5.2) |
325 (9.2) |
273 (9.8) |
3305 (5.99) |
0.001 |
|
Overweight |
26 (7.6) |
311 (20.5) |
222 (21.17) |
567 (30.33) |
1126 (25.31) |
0.001 |
|
Girls |
Underweight |
530 (16.03) |
1576 (11.23) |
65 (9.2) |
52 (9.6) |
2223 (12.28) |
0.024 |
|
About right |
195 (6.1) |
2309 (5.3) |
248 (9.2) |
137 (12.41) |
2889 (6.051) |
0.001 |
|
Overweight |
14 (14.28) |
596 (29.53) |
341 (36.36) |
473 (32.98) |
1424 (32.16) |
0.077 |
|
Total |
Underweight |
1072 (14.17) |
3180 (11.60) |
143 (9.09) |
126 (9.5) |
4521 (12.07) |
0.07 |
|
About right |
502 (5.17) |
4709 (5.3) |
573 (9.2) |
410 (10.7) |
6194 (6.02) |
<0.001 |
|
Overweight |
40 (10.0) |
907 (26.46) |
563 (30.3) |
1040 (31.53) |
2550 (29.13) |
0.004 |
Prevalence of adherence to weight changing plan by
perceived weight status, BMI and gender is shown in Table III.
Those adolescents who perceived their weight as overweight and were
actually overweight-BMI (30.3%) or obese-BMI (31.5%) had higher
frequencies of adherence to weight reduction diets. The above results
were also found among girls; the higher rates of being on weight
reduction plans was documented in 36.4% of overweight-perception and
overweight-BMI and 33% of overweight body image categories who were
actually obese by measured BMI. Similar patterns were reported among
boys.
Table IV Odds Ratios (95% CI) for Measured BMI and Perceived Weight Status: The CASPIAN-IV Study
| |
Adherence to weight changing plan based on a special
diet (yes/no) |
| |
|
OR |
95%C I |
P-value2 |
|
BMI1 |
|
Model I3 |
Underweight |
1.17 |
0.98, 1.39 |
0.072 |
|
Normal |
1 |
--- |
--- |
|
Overweight |
2.10 |
1.79, 2.46 |
<0.001 |
|
Obesity |
2.97 |
2.58, 3.43 |
<0.001 |
|
Model II4 |
Underweight |
1.28 |
1.06, 1.54 |
0.008 |
|
Normal |
1 |
--- |
--- |
|
Overweight |
1.97 |
1.67, 2.32 |
<0.001 |
|
Obesity |
2.98 |
2.55, 3.48 |
<0.001 |
|
Model III5 |
Underweight |
1.16 |
0.96, 1.41 |
0.110 |
|
Normal |
1 |
--- |
--- |
|
Overweight |
1.30 |
1.08, 1.57 |
0.006 |
|
Obesity |
1.47 |
1.21, 1.77 |
<0.001 |
|
Perceived weight |
|
Model I3 |
Underweight |
2.15 |
1.85, 2.51 |
<0.001 |
|
Normal |
1 |
--- |
--- |
|
Overweight and obesity |
6.44 |
5.57, 7.44 |
<0.001 |
|
Model II4 |
Underweight |
2.47 |
2.12, 2.89 |
<0.001 |
|
Normal |
1 |
--- |
--- |
|
Overweight and obesity |
6.22 |
5.34, 7.25 |
<0.001 |
|
Model III6 |
Underweight |
2.48 |
2.12, 2.90 |
<0.001 |
|
Normal |
1 |
--- |
--- |
|
Overweight and obesity |
5.32 |
4.46, 6.35 |
<0.001 |
|
1Overweight: BMI:85th-95th; obesity:
BMI>95th; 2 P-values are resulted from logistic
regression; 3Without adjusted (crude models); 4Adjusted
for age, sex, socio-economic status, screen time, family history
of obesity, physical activity; 5Additionally adjusted
for perceived weight status; 6Additionally adjusted
for BMI. |
Adjusted logistic regression models (Table
IV) showed that the odds ratios (ORs) of adherence to weight-
reduction plan was significantly higher for both overweight and obese
BMI, and underweight and overweight/obesity perception, in comparison to
their normal weight BMI or normal weight perceptions. Except for
underweight BMI, ORs were slightly attenuated by adjusting potential
confounders (model II: BMI, model II: perceived weight). Additionally
adjusted BMI models for perceived weight and body image models for BMI
indicated independent associations of BMI and weight perception on
adherence to weight reduction plans. Participants who perceived
themselves as overweight and obese, were more likely (OR= 5.32) to
follow weight reduction diets than their peers with normal-weight
perception. Actual overweight-BMI and obese-BMI individuals had greater
odds for being on a diet (1.3 and 1.47, respectively) compared to their
counterparts with normal BMI.
Discussion
In the present study, the association between
weight-perception and measured-BMI on weight-control practices of
Iranian adolescents were examined. We found that overweight and obese
individuals had greater odds for being on a diet. Participants who
perceived themselves as overweight or obese, were more likely to follow
weight-modifying plans than their peers with normal-weight perception.
The frequency of overweight perception was higher
among girls than boys, which is consistent with previous reports
[9,15,16]. In the present study, girls were more likely to follow
weight-modifying plans than boys. Disordered eating pattern such as
skipping meals and yo-yo dieting have been mentioned as restricted
weight-control behaviors among adolescents who attempt to achieve their
desired body image [17]. In our study, more than half of healthy-weight
subjects reported to be on a diet. Body image concerns; however, are not
always limited to overweight or obese girls. According to Herzog, et
al. [18], not only overweight women display a high degree of body
dissatisfaction, but also it is a characteristic in females of all
bodyweight categories. Therefore, it appears that adherence to weight-
loss plans is a prevalent dieting strategy irrespective of actual weight
status [17].
In the current study, both actual overweight and
obese individual adolescents were more likely to follow weight loss
behaviors compared to their normal-BMI peers. It might partly be
explained by social stigmatization and pressure to be thin as presented
by Western ideal of a slim body and cultural ideals of thinness [17].
Involvement in weight-control behaviors was higher among adolescents who
had overweight-obese perceived weight in comparison to normal weight
perception counterparts. In line with previous reports, being
dissatisfied with body weight and shape might lead to weight loss
dieting and eating disorders [19]. A notable strength of the present
study is that it explores body weight dissatisfaction and consequently
weight-control practices in a large nationally representative sample.
However, there are several limitations that must be addressed. First,
cross-sectional studies are not able to imply cause and effect
associations. Second, we assessed body image distortion with a single
item in the questionnaire. It is suggested to use more depth measures of
body shape and weight concerns and estimate different aspects of body
image concerns such as dissatisfaction with specific parts of body and
physical appearance (e.g., fat or muscularity). Third, we
estimated actual weight status by measured BMI. Thus, misclassification
of individuals according to BMI categories might occur, as an example
highly muscular subjects could be classified in overweight or obese BMI
centiles due to the muscle mass rather than body fat [20].
Our findings are of practical and clinical importance
for health care providers to evaluate and prevent risk for disordered
weight control practices. Higher levels of body satisfaction have been
found to exert protective effects against restrictive weight control
practices [21]. Studies have also indicated that modification of body
dissatisfaction was successful through school-based intervention
programs [22].The findings emphasize on necessity of promoting
gender-specific strategies to improve body image concerns and prevent
adverse health consequences of chronic dieting among adolescents.
Acknowledgments: The CASPIAN study was performed
with the cooperation of the Ministry of Health and Medical Education,
Ministry of Education and Training, Tehran University of Medical
Sciences Research Center, Child Growth and Development Research Center,
Isfahan University of Medical Sciences.
Contributors: MEM, MQ, GA, RK: conception
and design of the study; RH: acquisition of data; MB, MQ: analysis
and/or interpretation of data; MB, MA, RK: drafting the manuscript; MB,
MEM, MQ, RH, GA, RK: Revising the manuscript critically for important
intellectual content; MB, MEM, MQ, RH, GA, RK: approval of the version
of the manuscript to be published.
Funding: Child Growth and Development Research
Center, Research Institute for Primordial Prevention of Non-communicable
Disease, Isfahan University of Medical Sciences, Isfahan, Iran.
Competing interests: None stated.
|
What is already known?
•
Overweight and obese adolescents tend to be less satisfied
with their body weight compared to under-and normal-weight
counterparts.
What This Study Adds?
•
Participants, who perceived themselves as overweight/obese,
were more likely to follow weight-reduction diets than their
peers with normal-weight perception. Overweight and Obese
individuals had greater odds for being on a diet compared to
their normal-BMI counterparts.
|
References
1. Wood-Barcalow NL, Tylka TL, Augustus-Horvath CL.
"But I Like My Body": Positive body image characteristics and a holistic
model for young-adult women. Body Image. 2010;7:106-16.
2. Smolak L. Body image in children and adolescents:
where do we go from here? Body Image. 2004;1:15-28.
3. Schneider S, Weiss M, Thiel A, Werner A, Mayer J,
Hoffmann H, et al. Body dissatisfaction in female adolescents:
extent and correlates. Eur J Pediatr. 2013; 172:373-84.
4. Eisenberg ME, Neumark-Sztainer D, Paxton SJ.
Five-year change in body satisfaction among adolescents. J Psychosom
Res. 2006;61:521-7.
5. Andrist LC. Media images, body dissatisfaction,
and disordered eating in adolescent women. MCN Am J Matern Child Nurs.
2003;28:119-23.
6. Field AE, Javaras KM, Aneja P, Kitos N, Camargo
CA, Jr., Taylor CB, et al. Family, peer, and media predictors of
becoming eating disordered. Arch Pediatr Adolesc Med. 2008;162:574-9.
7. Kanter R, Caballero B. Global gender disparities
in obesity: a review. Adv Nutr. 2012;3:491-8.
8. Schulte SJ, Thomas J. Relationship between eating
pathology, body dissatisfaction and depressive symptoms among male and
female adolescents in the United Arab Emirates. Eat Behav.
2013;14:157-60.
9. Kelishadi R, Marashinia F, Heshmat R, Motlagh ME,
Qorbani M, Taslimi M, et al. First report on body image and
weight control in a nationally representative sample of a pediatric
population in the Middle East and North Africa: the CASPIAN-III study.
Arch Med Sci. 2013;9:210-7.
10. Khashayar P, Heshmat R, Qorbani M, Motlagh ME,
Aminaee T, Ardalan G, et al. Metabolic syndrome and
cardiovascular risk factors in a national sample of adolescent
population in the Middle East and North Africa: The CASPIAN III Study.
Int J Endocrinol. 2013; 2013:702095.
11. Kelishadi R, Majdzadeh R, Motlagh ME, Heshmat R,
Aminaee T, Ardalan G, et al. Development and evaluation of a
questionnaire for assessment of determinants of weight disorders among
children and adolescents: The Caspian-IV Study. Int J Prev Med.
2012;3:699-705.
12. Kelishadi R, Ardalan G, Qorbani M, Ataie-Jafari
A, Bahreynian M, Taslimi M, et al. Methodology and early findings
of the fourth survey of Childhood and Adolescence Surveillance and
Prevention of Adult Non-communicable Disease in Iran: The CASPIAN IV
study. Int J Prev Med. 2013;4:1451-60.
13. Knowles KM, Paiva LL, Sanchez SE, Revilla L,
Lopez T, Yasuda MB, et al. Waist circumference, body mass index,
and other measures of adiposity in predicting cardiovascular disease
risk factors among Peruvian adults. Int J Hypertension.
2011;2011:931402.
14. Li C, Ford ES, Mokdad AH, Cook S. Recent trends
in waist circumference and waist-height ratio among US children and
adolescents. Pediatrics. 2006;118:e1390-e8.
15. Petracci E, Cavrini G. The effect of weight
status, lifestyle, and body image perception on health-related quality
of life in children: a quantile approach. Qual Life Res.
2013;22:2607-15.
16. Mohnke S, Warschburger P. [Body dissatisfaction
among female and male adolescents: comparing prevalence, predictors, and
consequences between the sexes]. Prax Kinderpsychol Kinderpsychiatr.
2011;60:285-303.
17. Pon LW, Mirnalini K, Mohd Nasir M. Body image
perception, dietary practices and physical activity of overweight and
normal weight Malaysian female adolescents. Malays J Nutr.
2004;10:131-47.
18. Herzog DB, Keller MB, Lavori PW, Kenny GM, Sacks
NR. The prevalence of personality disorders in 210 women with eating
disorders. J Clin Psychiatry. 1992;53:147-52.
19. Cho JH, Han SN, Kim JH, Lee HM. Body image
distortion in fifth and sixth grade students may lead to stress,
depression, and undesirable dieting behavior. Nutr Res Pract.
2012;6:175-81.
20. Calzo JP, Sonneville KR, Haines J, Blood EA,
Field AE, Austin SB. The development of associations among body mass
index, body dissatisfaction, and weight and shape concern in adolescent
boys and girls. J Adolesc Health. 2012;51:517-23.
21. Neumark-Sztainer D, Paxton SJ, Hannan PJ, Haines
J, Story M. Does body satisfaction matter? Five-year longitudinal
associations between body satisfaction and health behaviors in
adolescent females and males. J Adolesc Health. 2006;39:244-51.
22. Yeh MC, Liou YM, Chien LY. Development and
effectiveness of a school programme on improving body image among
elementary school students in Taiwan.J AdvNurs. 2012;68:434-43.
|
|
|
 |
|
