|
Kilaru A., Griffiths P.L.*, Ganapathy S. and Ghosh
Shanti**
From Belaku Trust, 697 15th Cross Road, J.P. Nagar
Phase II, Bangalore 560 078. *Department of Human Sciences, Loughborough
University, UK; **Pediatrician and MCH Consultant, New Delhi, India.
Correspondence to: Kilaru A., Belaku Trust, 697 15th
Cross Road, J. P. Nagar II Phase, Bangalore 560 078, Karnataka, India.
E-mail: [email protected]
Abstract
Objective: To evaluate a nutrition education
intervention designed to improve infant growth and feeding practices.
Design: An intervention study using monthly nutrition education
delivered by locally trained counsellors targeted at caregivers of
infants aged 5-11 months. Comparison of outcomes for 2 groups - one
non-intervention group of infants enrolled in 1997 that did not receive
the intervention in the first year of life, and an intervention group of
infants enrolled 1998-1999 that received the nutrition education.
Setting: 11 randomly selected and 2 purposively selected villages of
south Karnataka. Subjects: 138 Infants (n = 69 intervention) aged
5 -11 months. Methods: Families were administered a monthly
questionnaire on feeding and child care behavior, and study infants were
weighed at this time, using the SECA solar scales, developed for UNICEF.
Logistic regression was used to examine differences between intervention
and non- intervention infants in infant feeding behavior outcomes.
Results: Statistically significant improvement was found in weight
velocity for female infants in the intervention group. These infants
were also more likely to exhibit at least four positive feeding
behaviors – intervention infants had a higher mean daily feeding
frequency (more likely to be fed solids at least four times a day (OR =
4.35, 95% CI =1.96, 10.00), higher dietary diversity (more likely to
receive a more diverse diet OR = 3.23, 95% CI = 1.28, 7.69), and were
more likely to be fed foods suggested by the counsellors such as bananas
(OR = 10.00, 95% = 2.78, 33.3) compared to non-intervention infants.
Conclusion: Nutrition education and counselling was significantly
associated with increased weight velocity among girls and improved
feeding behavior among both boys and girls. These results provide
further evidence that community-based nutrition programs that emphasise
appropriate feeding and care behavior can be used to prevent and address
early childhood malnutrition in poor households.
Key words: India, Infants, Intervention, Nutrition education.
Childhood malnutrition is a significant
health problem in developing countries and one of the main causes of
infant and child morbidity and mortality(1-4). Over half of the
underweight children in the world live in India, where approximately
47% children under the age of three are underweight and 46% are
stunted(5). Growth faltering normally begins around six months of age,
the time when a diet based predominantly on breast milk begins to
include complementary foods, which when delivered inappropriately
results in growth faltering(6). Infants in Karnataka display this
pattern of malnutrition, with those aged less than six months having a
low prevalence of underweight (6%), compared to a much higher
prevalence of underweight (39%) aged 6-11 months(5).
A lack of food is not the sole cause of
malnutrition. Lack of awareness and know-ledge about feeding amount,
frequency, type of food, etc., contributes significantly to poor
nutritional status among children even in families where adults meet
their daily requirements(7). Interventions have shown that it is
possible to improve infant growth and feeding practices through
action-oriented messages(8). Probably the most comprehensive Indian
studies of infant-focused nutrition education interventions have been
conducted by Bhandari and colleagues(9,10). The findings from these
studies suggest that nutrition education messages can result in a
longer duration of exclusive breastfeeding, decreased diarrheal
morbidity, and increased energy intake.
The objective of the current study was to gain an
understanding of infant feeding practices in the period when infants
are vulnerable to growth faltering and evaluate the effect of a
nutrition education intervention on these practices between 7-11
months of age in rural Karnataka. This paper builds on an earlier
report where it was shown that the nutrition education intervention
had a positive impact on the growth of female infants but not
males(11).
Subjects and Methods
Sample
Infants aged less than six months were enrolled on
an on-going basis between 1997-1999 from 13 villages, 11 randomly
selected and two purposively selected to cover a range of settings;
one, a small village with a tribal community and the other, a large
village with a mix of public, private and traditional health care
providers. All infants and recent births identified in each of the 13
villages by fieldworkers through a combination of house visits, the
snowball technique, and by the Auxilary Nurse Midwife (ANM)) during
the study period were enrolled. As many of the respondents were
illiterate, verbal consent was obtained. Information collection
started with a baseline questionnaire including socio-demographic
characteristics of the household. Monthly questionnaires were used to
document feeding practices, including a 24-hour recall of foods and
fluids consumed, weight of the infants and morbidity experiences in
the previous month; height was measured every three months. The study
team visited infants until 24 months of age. Over the three years in
which the study was conducted, 468 infants were recruited.
A year into the study, data revealed that levels of
malnutrition were high and knowledge of appropriate infant feeding
practices was very low. The Belaku Trust’s ethical advisory group
decided not to conduct a randomised control study of the effect of
nutrition education and instead start the intervention nutrition
education for all families in the study. However, infants enrolled in
the study in early 1997 were already a year old by then and had
experienced their first year of life without the nutrition education.
This group was considered a non-intervention comparison group (NI) (n
= 69) for the first year of life for the analysis and other infants
who were not older than 5 months of age when the counselling began (n
= 173) were considered an intervention group (I). Hence, the
sub-sample of infants for this analysis is 242 (173 + 69). Although we
are comparing data from different calendar years (because infants were
recruited at different times), there were no significant events that
influenced food supply in the area during 1997-1999 and there were no
significant changes in public health services offered, therefore we
consider the data to be comparable. The remaining infants in the study
were exposed to the intervention some-time between 5 and 11 months of
age and are excluded for this analysis. Dropout from the study prior
to 12 months of age was very low and thus we do not expect it to have
a bearing on the results.
The sixty-nine non-intervention infants (NI) (of
whom 34 are females) did not receive the intervention in 1997 but were
exposed to the normal standard of care available in that time period
in the villages, provided by the anganwadi workers (AWW) and auxiliary
nurse midwives (ANM). The 173 intervention infants (I), of which 83
are females, were recruited into the study during 1998 and 1999 and
were exposed to the standard care available plus monthly nutrition
counselling from 5 months of age or earlier.
Intervention
The field research staff (high school or college
educated fieldworkers who live in close proximity to the study
villages) also provided the nutrition education. They were trained by
Belaku Trust and external MCH consultants (a pediatrician and a
nutritionist)(12).
After administering the monthly questionnaire, the
field staff would discuss reported feeding practices with the primary
caregiver. The total time for the questionnaire and counselling was
about 1½ hours. Field staff would review dietary information from the
questionnaires and talk about ways of improving the quality and
quantity of the diet through questions and probes asked in a friendly
manner. The field staff would often provide personal examples of how
to overcome challenges in feeding young children, including the kind
of communication skills needed to coax young children to eat. The
weight trajectory (using a growth chart), episodes of illness, and
developmental milestones were also discussed. The tone of the
counselling was empathy and concern for the child and family’s
well-being. Senior staff reviewed all questionnaires and were often
present for the sessions. The counsellors were trained to be mindful
of household constraints especially in terms of available household
food, limited financial resources, decision-making capacity and
privilege within the family structure. The key counselling messages
included in the study for infants aged 5-11 months focused on:
• use of developmentally appropriate local foods
and preparation of these foods;
• appropriate feeding frequency;
• gradually increasing food diversity;
• complementary feeding followed by
breastfeeding;
• avoidance of feeding bottles.
Statistical Analysis
Analysis was done using SPSS(13). Logistic
regression (to control for background differences such as economic
status) was used to examine differences between intervention and
non-intervention infants between 7-11 months of age in outcomes
related to the key counselling messages. The analysis for the effect
of the intervention is examined from 7 months of age to allow time for
changes in feeding practices and changes in the child’s weight to be
captured.
In addition to feeding behaviors, a linear
regression was performed with frequency of breastfeeding in 24 hours
at 11 months of age as the outcome variable. This was to assess
whether any increase in the frequency or variety of complementary
foods was offset by a decrease in the number of times an infant was
breastfed.
Since there were a larger number of intervention
infants (173), than non-intervention (69) we wished to allow for any
statistical effect caused by these different numbers of infants in
each group. A random sample of 69 intervention infants was selected to
test the analysis. A sample size of 69 in each experimental group will
detect differences in the outcome variables studied of between 18-24%
between the intervention and non-intervention group (with P = 0.05 and
80% power) in a bivariate analysis depending on the outcome being
examined.
No differences were observed in the outcomes,
suggesting that the disparity in numbers does not affect our findings
- hence our final results presented are for the entire group of 173
(I) group infants and 69 (NI) group infants. In addition, because the
children had not been randomly allocated to the intervention and
non-intervention groups, potentially confounding factors were
controlled for in the regression models. These included sex, village
of residence, caste, mother’s education, economic level, and the
mother’s age at the child’s birth. Since higher weight velocity was
observed only in intervention girls in bivariate results, a
sex-intervention interaction term was included in the regression
models. To account for baseline weight, weight at 6 months of age was
also controlled for in the models.
Results
Most background characteristics were not
statistically different between the intervention and non-intervention
groups of infants (Table I), except for variable called village group.
This was constructed by classifying the villages in which the families
live according to the level of health services available (facility
type and extent of outreach services). Because of this, village group
was controlled for in the regression model.
TABLE I

Characteristics of the Intervention and Non-Intervention Infants.
| |
Intervention infants
(n = 173) (%) |
Non-intervention
(n = 69)(%) |
Female
|
54
|
46
|
Scheduled caste/ tribe
|
14
|
15
|
Mother no education
|
48
|
42
|
Village group 1*
|
61
|
51
|
Village group 2
|
13
|
30
|
Village group 3
|
26
|
19
|
Low standard of living+
|
36
|
33
|
Mother aged < 20 at birth
|
33
|
43
|
Mean weight for age Z-score 6 months (SD)
|
–1.08
(1.00)
|
–0.81
(1.04)
|
* Villages were grouped according to geographic region and the type of health care available.
Group 1 has poor access generally to health facilities and no active health workers. Group 2
has moderate access to a primary health sub-centre, and has an active Auxiliary Nurse
Midwife (ANM) who is involved in outreach.  Group 3 contains one large village which has
access to a mix of services, private providers, a missionary hospital and a government clinic,
but no active outreach worker.
+ Composite index of ownership of household consumer goods, based on the local value of
goods. Low standard of living refers to the bottom tertile value of the owned household goods.
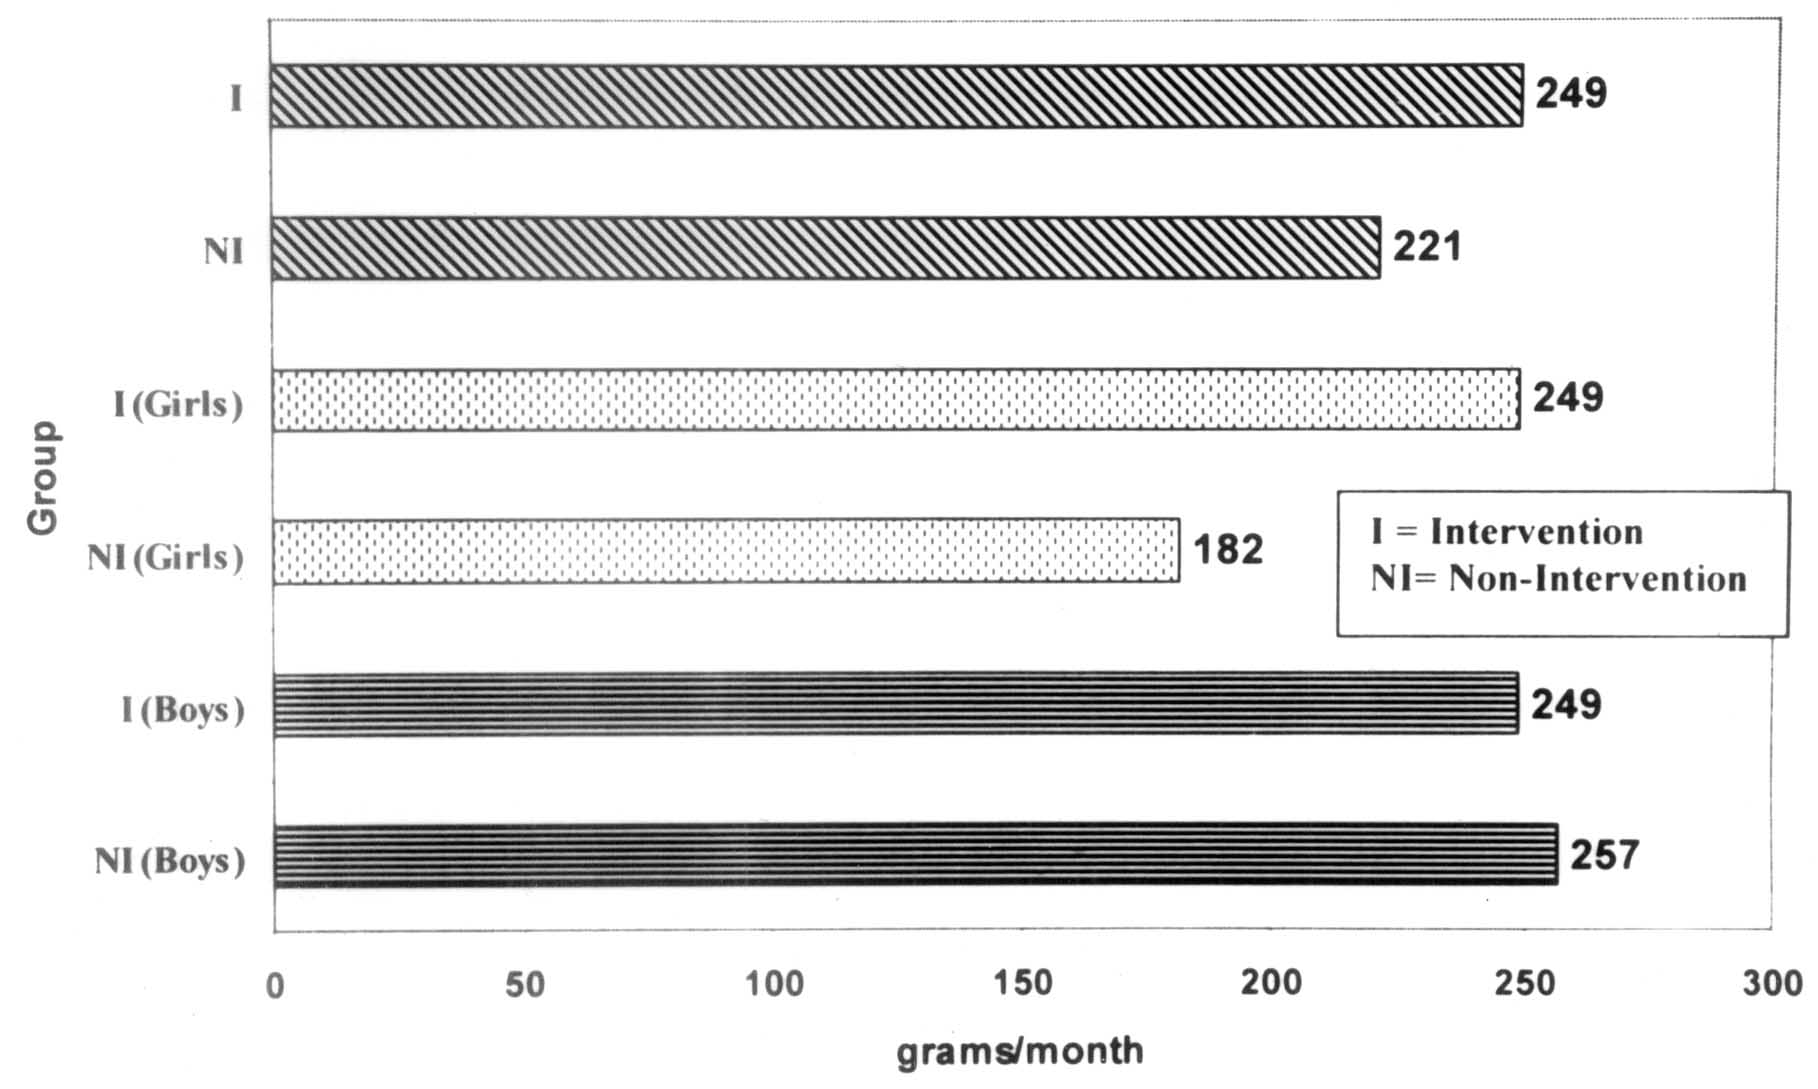
Females enrolled in the intervention had a weight
velocity that was 77 g per month greater than non- intervention girls
between 6-10 months of age(11) (Fig. 1, bivariate results). This was
also tested using linear regression controlling for socio-demographic
factors that either varied between the I and NI groups, or because
they have been shown in the literature to be predictors of nutritional
status. Including a sex-intervention interaction term in the
regression model revealed that female infants in the intervention
group had greater weight velocities relative to the other groups (NI
and I boys, and NI girls).
 |
|
Fig. 1. Average weight velocity, stratified
by intervention group. |
Descriptive statistics for the feeding behavior
outcomes are displayed in Table II. Significant differences were
observed in the feeding of bananas, with intervention infants being
more likely to eat these (33%) compared to non-intervention infants
(4%). Intervention infants were also significantly more likely to be
fed at least four times in 24 hours in addition to breast milk (78%
versus 51%) and to receive foods from at least five different food
groups (42% versus 19%) in comparison to non intervention infants.
TABLE II
Percentage of Infants Displaying Positive Feeding Behavior by Intervention Group.
| |
Intervention
(%) |
Non-intervention
(%) |
P-value
|
Not feeding animal milk ages 7-11 months
|
41
|
29
|
0.15
|
Not using a bottle ages 7-11 months
|
85
|
72
|
0.06
|
Feeding appropriate semi-solid foods ages 7-11 months
|
32
|
26
|
0.45
|
Feeding bananas ages 7-11 months
|
33
|
4
|
< 0.001
|
|
Feeding at least 4 times in 24 hours in addition to breast milk
|
ages 7-11 months
|
78
|
51
|
< 0.001
|
Feeding at least 5 different food groups* age 11 months
|
42
|
19
|
0.01
|
Displays at least 4 positive feeding behaviors†
|
65
|
49
|
0.06
|
* Food groups examined were dairy, cereal, protein, fruit, vegetables, oil and fat, sugar
and savory snacks.
† Out of the six positive behaviors shown in the table above.
Odds ratios with 95% confidence intervals were
examined from the logistic regression models for feeding behavior.
Non-intervention infants were observed to be significantly less likely
to be fed bananas (adjusted OR = 10.00, CI 2.78, 33.33), to be fed
solids at least four times in 24 hours (adjusted OR = 4.35, CI 1.96,
10.00); and to be fed from at least five different food groups
(adjusted OR = 3.23, CI 1.28, 7.69) compared to intervention infants.
In addition, we constructed a composite score of 6
positive feeding behaviors and compared intervention and
non-intervention groups. Intervention females were more likely to
report at least 4 of the 6 positive behaviors than non-intervention
females (adjusted OR = 2.78, CI 1.02, 7.69). No significant
differences were observed for male intervention or non-intervention
infants.
Discussion
One of the most significant findings is the
increase in weight velocity among the intervention girls compared to
NI girls. Although the increase is small, it suggests that nutrition
education can improve growth in poor households, and may be especially
effective in regions where females are socially discriminated against.
It is difficult to say why this effect was seen only in girls; boys
tend to have faster rates of gain relative to girls and as such are
considered more sensitive to the environment(14); we therefore may
have expected more effect in boys in response to improved feeding
practices. However, a study in Zaire found that girls showed catch-up
growth more quickly than boys(15) and what we see here may be a
demonstration of this. It is also possible that the fieldworkers paid
greater attention to families with girls, although they were not
instructed to do so, because of an expectation of higher risk of poor
growth for girls due to a culture of female discrimination.
Girls in the intervention group were more likely to
have at least 4 positive feeding behaviors compared to NI girls. This
suggests that changes in a combined set of feeding behaviors may
account for the improved weight gain observed in intervention girls
even though no single feeding practice appears significantly different
for the girls. Further analyses will use observed feeding behavior in
weight velocity regressions to see if the increase can be explained by
these positive behavior changes.
The study limitations include the non-randomised
allocation of the intervention and non-intervention groups, which, as
explained above, was done for ethical reasons. However, there is
increasing recognition of the importance and value of evaluation
research to public health policy and practice, especially when it is
unethical to conduct randomised control trials because the
intervention being withheld has a strong potential for benefit(16). In
addition, information on exact portion sizes would have been useful in
assessing the impact of the intervention to see if there was a direct
effect on growth; these data were collected, but were unreliable, due
to the well-known difficulties of collecting such data in the field.
These findings support other evidence that there is
significant scope for improving feeding behavior and growth through
counselling and education (9,10,17-19). We have observed significant
positive differences in weight velocity, feeding frequency, dietary
diversity, and in the use of specific recommended and locally
available foods(20). Ideally, it would be better to counsel women and
their families much earlier in the infant’s life, or even to begin
during antenatal care. Addressing groups of families through the
anganwadi, rather than individuals, would be a way of using existing
programs and reducing the cost of nutrition education interventions.
Current recruitment requires AWWs to have at least a 10th standard
education, so training them to fulfill their role as community
nutrition advisors is indeed possible. Although macro-level strategies
to reduce food insecurity are needed, in many poor households there is
usually some food available that can be modified and fed to young
children with appropriate frequency. Teaching families to increase
feeding frequency, increase dietary diversity, modify household food
as well as raising awareness on existing food taboos for young
children (e.g., bananas and eggs), could reduce the incidence of
growth faltering and subsequent malnutrition.
Acknowledgements
We wish to thank UNICEF, New Delhi, for supporting
this study. The authors would like to thank the field staff Shobha
Prakash, Jyothi, Mallika, Mani, Tejaswini, C.K. Shoba and Anila, who
delivered the intervention, and Gopal; ANM Jayanti for her dedication
to her work and assistance to the study. We also thank the other
members of the research team: Dr. Jayashree Ramakrishna, Dr. Usha
Abraham, Shanti Mahendra, Srilakshmi Divakar and Dr. Thilaka Baskaran;
we also thank Jahnavi Vasudevan for critical comments.
Contributors: Ganapathy and Ghosh designed the
study; Kilaru and Ganapathy implemented the study. The analysis and
draft manuscript was done by Griffiths and Kilaru. All four authors
reviewed the manuscript.
Funding: UNICEF, New Delhi.
Competing interests: None stated.
|
Key Messages |
|
• Nutrition education and counselling lead to significant increase
in weight velocity among girls.
• Counseling women and their families in appropriate feeding
and core behavior could reduce the incidence of malnutrition.
|
|
|
1. Mosley WH, Cowley P. The challenge of world
health. Population Bulletin 1991; 46: 2-33.
2. Gage TB, Zansky SM. Anthropometric
indicators of nutritional status and level of mortality. Am J of
Human Biol 1995; 7: 679-691.
3. Murray CJ L, Lopez AD, editors. The global
burden of disease: a comprehensive assessment of mortality and
disability from diseases, injuries and risk factors in 1990 and
projected to 2020 (Vol 1. Global burden of disease and injury
series). Boston: Harvard School of Public Health; 1996.
4. Murray CJ, Lopez AD. Mortality by cause for
eight regions of the world: Global burden of disease study. Lancet
1997; 349: 1269-1276.
5. IIPS (International Institute of Population
Sciences) and ORC Macro. National Family Health Survey (NFHS 2),
India 1998-99. Mumbai: IIPS; 2000.
6. World Health Organization, Department of
child and adolescent health and development. Complementary feeding
family foods for breastfed children. WHO/NHD/00.1; Geneva; 2000.
7. National Nutrition Monitoring Bureau. Diet
and nutritional status of rural population. Technical report no.
21. National Institute of Nutrition (ICMR), Hyderabad, India;
2001.
8. Caulfield LE, Huffman SL, Piwoz EG.
Interventions to improve the complementary food intakes of 6-12
month old infants in developing countries: Impact on growth,
prevalence of malnutrition and potential contribution to child
survival. Food and Nutrition Bulletin 1999; 20: 183-200.
9. Bhandari N, Bahl R, Nayyar B, Khokhar P,
Rohde JE, Bhan MK. Food supplementation with encouragement to feed
it to infants from 4 to 12 months of age has a small impact on
weight gain. J Nutr 2001; 131: 1879-1880.
10. Bhandari N, Bahl R, Mazumdar S, Martines J,
Black RE, Bhan MK. Effect of community-based promotion of
exclusive breastfeeding on diarrheal illness and growth: A cluster
randomised controlled trial. Lancet 2003; 361: 1418-1423.
11. Ghosh S, Kilaru A, Ganapathy S. Nutrition
Education and infant growth in rural Indian infants: narrowing the
gender gap. J Indian Med Assoc 2002; 100: 483-490.
12. Ghosh S. The feeding and care of infants
and young children. New Delhi: Voluntary Health Association of
India; 1985.
13. SPSS. Statistical Package for the Social
Sciences. Version 11. SPSS Inc. Chicago, Illinois; 2001.
14. Bielicki T. Physical growth as a measure of
the economic well-being of populations: the twentieth century. In:
F. Falkner, J.M. Tanner editors. Human Growth, vol 3, New York:
Plenum Press; 1986.
15. Hauspie RC, Pagezy H. Longitudinal study of
growth of African babies: An analysis of seasonal variations in
the average growth rate and the effects of infectious diseases on
individual and average growth patterns. Acta Pediatr Scand 1989;
Suppl. 350: 37-43.
16. Kirkwood B. Making public health
interventions more evidence based. BMJ [online WWW]. 2004
April;328:966-967. http://bmj.bmjjournals.com/cgi/content/full/328/7446/966?etoc&eaf
[23 April 2004].
17. Cerquieria MT, Olson CM. Nutrition
education in developing countries: An examination of recent
successful projects. In: P. Pinstrup-Andersen, D .Pelletier, H.
Alderman editors. Child Growth and Nutrition in Developing
Countries. Delhi: Oxford University Press; 1995.
18. Zeitlin MF, Formacion C. Nutrition
education, study II. In: J. Austin, M.F. Zeitlin editors.
Nutrition Intervention in Developing Countries: An Overview.
Cambridge, MA: Oelgeschlager, Gunn and Hain; 1981.
19. Hornik R. Nutrition Education: A State of
the Art Review. ACC/SCN Nutrition Policy Discussion Paper No 1.
Rome: United Nations Food and Agricultural Organization; 1985.
20. Ghosh, S. Nutrition and Child Care; A Practical Guide. 2nd
edition. New Delhi: Jaypee Bros; 2004.
|