|
|
|
Indian Pediatr 2017;54: 183-184 |
 |
What Predicts Intergenerational Change in
Anthropometry?
|
|
Tim J Cole
From the Population, Policy and Practice Programme,
UCL Great Ormond Street Institute of Child Health,
London, UK.
Email: [email protected]
|
|
I
t is a truth universally acknowledged, that
children now are taller, heavier and fatter than their parents and
grandparents were. Trends in adult height over the past 100 years have
recently been documented in detail by the NCD Risk Factor Collaboration,
comparing mean adult height by sex in 200 countries between 1896 and
1996 [1]. Some countries have seen height increase by up to 20 cm. In
addition, the pace of growth in childhood has accelerated, so that adult
height is now reached at an earlier age. This has the effect of
inflating the apparent increase in height during childhood, as children
of a particular age are both taller and more advanced in developmental
age [2]. Weight has also been increasing in line with height; but over
the past half-century, it has outstripped height, and this has led to
the secular trend of rising body mass index (BMI) and the public health
concerns of increasing obesity.
Documenting these secular trends in child growth
usually involves comparing anthropometry in cross-sectional studies at
different times; for example national surveys carried out every 10 or 15
years [3,4]. It is unusual to be able to make a direct comparison of the
growth of children with their parents.
The article by Sinha, et al. [5] in this issue
of Indian Pediatrics uses an interesting and unusual
intergenerational study design to do just that – the growth patterns of
children born around 1970 and recruited to the New Delhi Birth Cohort
were compared with those of their own children as measured more
recently. The comparisons focussed on the age groups 0-5 and 5-10 years,
where the outcomes were the intergenerational Z-score changes in height,
weight and BMI, adjusted for age and sex. The findings were striking –
over the follow-up period, the children increased in height by a whole
standard deviation, corresponding to 3.9 cm in the younger children and
6.4 cm in the older. Weight increased similarly, by 1.3 and 5.4 kg in
the two age groups; while BMI changed only in the older children, by 1.9
kg/m 2, and in the 0-5 year
group it remained the same. The authors concluded that children tend to
"grow up" before they "grow out."
This is one surprise, that the younger children were
not fatter than their parents were at the same age, despite the steep
rise in obesity prevalence that has occurred over the period. But the
intergenerational study design also provided other interesting insights,
some of them counter-intuitive: the increases were greater for smaller
and older parents, with poorer sanitation and higher education, and for
older children. It is instructive to consider each of these associations
in turn, and to explore their relevance to health policy. By far the
strongest association was with parental size – the secular increase was
appreciably greater for shorter parents. The authors provide three
potential explanations for this: "statistical regression to the mean,
narrowing of socio-economic inequalities and greater biological response
among deprived strata", and they are optimistic that it represents a
reduction in height inequity.
However, they are perhaps over-optimistic, in that
the most likely explanation is the first of the three, regression to the
mean, which is a statistical not a social or biological construct. It
states simply that extreme measurements (e.g. height) are on
average less extreme on re-measurement; so shorter parents tend to
produce somewhat less short children, and vice versa for taller
parents and children. It was first described by Francis Galton, working
in the same context as here, with the heights of parents and children
[6]. As a statistical phenomenon, regression to the mean is substantial
and ever-present; so it tends to dwarf any other factors that may be
operating.
The next strongest association the authors found was
with parental age; the children of older parents tended to be relatively
taller. The authors speculate that the parents being older meant they
were exposed longer to improved living conditions, and passed this on to
their children. However, there is another more likely explanation; the
parents were all born around 1970, so if they were older when their
children were born, the children must have been born later and hence
experienced more of the underlying secular trend. In this sense,
parental age is simply a measure of passing time, and the child’s year
of birth would have been similarly predictive.
The child’s age was another important predictor of
secular change, which was appreciably greater in the older age group.
The authors view this as a proxy for exposure duration, but again it is
more likely to be structural, reflecting the advanced developmental age
of the children compared to their parents; so they reach milestones
relatively earlier than their parents and hence appear taller. This
effect increases with age until puberty and then disappears once adult
height is reached [7]; so one would expect it to be greater for age 5-10
y than age 0-5 y.
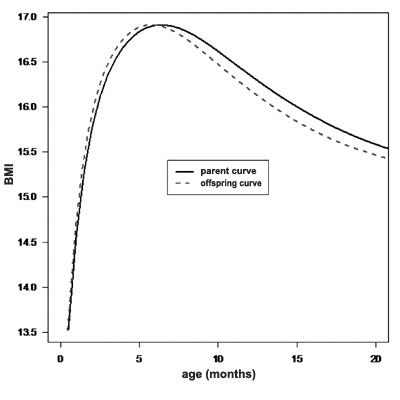
The secular change in developmental age may also
explain why BMI did not increase in the 0-5 year group. The BMI curve
typically rises steeply in infancy, peaks just before 1 year, then falls
until adiposity rebound at age 4-5 y when it rises again [8]. The
advance in developmental age shifts this pattern to the left, with both
the age at BMI peak and the age at adiposity rebound getting earlier
[9,10], independently of any secular increase in BMI. Because of its
shape, the age-shifted curve is slightly lower than the original curve
at some ages (Fig. 1), and this generates an apparent fall
in BMI that partially compensates for the secular BMI rise. So, in this
sense the authors are right that children tend to "grow up" before they
"grow out."
 |
|
BMI from the WHO growth standard. The age
scale for the offspring curve is shrunk by 10% compared to the
parent curve.
Fig. 1 The effect of advanced developmental age on the
BMI curve in early life, based on median.
|
The WASH (Water, Sanitation and Hygiene) score, was
the one socio-economic factor to have a measurable effect on the secular
change in height, weight and BMI. It presumably means that the children
brought up in better conditions than their parents grew better as a
result. Weight and BMI were also relatively greater in children whose
parents were more educated; this though looks more like greater obesity
than improved growth, as there was no associated height effect.
In summary, the study confirms intergenerational
increases in height, weight and BMI, and identifies several factors that
predict them. However, most of the factors reflect either statistical or
biological associations that may not be very relevant to policy. In
terms of policy relevance, only sanitation in the parent cohort impacted
significantly on the secular height trend, suggesting that improved
sanitation is a worthwhile policy goal. Sanitation in the child cohort
did not show an effect, but this may be because it has improved
materially in 30 years, making its impact harder to detect.
Funding: None; Competing interest: None
stated.
References
1. NCD Risk Factor Collaboration. A century of trends
in adult human height. Elife. 2016. Jul 26;5. pii: e13410. doi:
10.7554/eLife.13410.
2. Ong KK, Ahmed ML, Dunger DB. Lessons from large
population studies on timing and tempo of puberty (secular trends and
relation to body size): The European trend. Mol Cell Endocrinol.
2006;254:8-12.
3. Fredriks AM, van Buuren S, Burgmeijer RJ,
Meulmeester JF, Beuker RJ, Brugman E, et al. Continuing positive
secular growth change in The Netherlands 1955-1997. Pediatr Res.
2000;47:316-23.
4. Kim JY, Oh IH, Lee EY, Choi KS, Choe BK, Yoon TY,
et al. Anthropometric changes in children and adolescents from 1965
to 2005 in Korea. Am J Phys Anthropol. 2008;136:230-6.
5. Sinha S, Aggarwal AR, Osmond C, Fall CHD, Bhargava
SK, Sachdev HS. Intergenerational change in anthropo-metric indices and
their predictors among children in New Delhi Birth Cohort. Indian
Pediatr. 2017;54:185-92.
6. Galton F. Regression towards mediocrity in
hereditary stature. J R Anthropol Inst. 1886;15:246-63.
7. Cole TJ. Secular trends in growth. Proc Nutr Soc.
2000;59:317-24.
8. Rolland-Cachera MF, Deheeger M, Bellisle F, Sempé
M, Guilloud-Bataille M, Patois E. Adiposity rebound in children: A
simple indicator for predicting obesity. Am J Clin Nutr. 1984;39:129-35.
9. Johnson W, Choh AC, Lee M, Towne B, Czerwinski SA,
Demerath EW. Characterization of the infant BMI peak: Sex differences,
birth year cohort effects, association with concurrent adiposity, and
heritability. Am J Hum Biol. 2013;25:378-88.
10. Doi L, Williams AJ, Frank J. How has child growth
around adiposity rebound altered in Scotland since 1990 and what are the
risk factors for weight gain using the Growing Up in Scotland birth
cohort 1? BMC Public Health. 2016;16:1081.
|
|
|
 |
|
