|
|
|
Indian Pediatr 2010;47: 477-485 |
 |
Blood Pressure Distribution in Indian Children |
|
Manu Raj, Karimassery Ramaiyer Sundaram*, Mary Paul and Raman Krishna
Kumar
From the Departments of Pediatric Cardiology and
*Biostatistics, Amrita Institute of Medical Sciences and
Research Centre, Kochi, India.
Correspondence to: Dr Manu Raj, Clinical Associate
Professor (Pediatrics), Division of Pediatric Cardiology, Amrita Institute
of Medical Sciences and Research Centre, Kochi, Kerala.
Email: drmanuraj@gmail.com
Received: February 25, 2009;
Initial review: April 15, 2009;
Accepted: May 21, 2009.
Published online: 2009 September.
PII:S097475590900123-1
|
|
Abstract
Objective: To determine blood pressure
distribution in schoolchildren and to derive population specific
reference values appropriate for age, gender and height status.
Design: Cross sectional observational study.
Setting: Schools in Ernakulam district, Kerala,
India, during 2005-06.
Methods: Stratified random cluster sampling
method was used to select the children. Blood pressure and
anthropometric data were collected from 20,263 students of 5-16 years
age. Three readings of blood pressures of each child were taken by
mercury sphygmomanometer and mean was taken for analysis. Blood pressure
percentiles in relation to gender, age and height were estimated from a
non-overweight population of 18,931 children using polynomial regression
models.
Results: Children from study population have
higher diastolic pressures for both sexes than international standard
across all age groups. For systolic blood pressure, girls showed higher
values than the international standard while for boys, the difference
appears to be minimal.
Conclusions: Blood pressure distribution in
children from our study population demonstrates a different pattern in
comparison to existing international reference. Higher blood pressure
values in the study population are of considerable public health
significance.
Key words: Adolescents, Blood pressure, India, Obesity,
Overweight.
|
|
H
ypertension in children is an
emerging public health issue attracting the attention of medical
professionals worldwide. Hypertension in children exhibits strong
correlations with various factors, among which bodyweight assumes
considerable significance(1-4). Excess weight resulting in hypertension in
children deserves immediate attention even in large developing economies
like India, China and Brazil(2,5,6). Data from diverse populations shows
that the tracking of blood pressure from childhood into adulthood is very
strong(7). In addition to aggravating cardiovascular morbidity and
mortality burden, hypertension contributes significantly to other chronic
diseases such as stroke and end-stage organ damage(8,9). Throughout
adulthood, blood pressure is strongly and directly related to vascular as
well as overall mortality(10).
The existing reference values for blood pressure in
children were derived from a multiethnic pediatric population from
USA(11). The application of this international reference to other
populations that differ in various demographic factors, may not be valid.
The aim of this study was to plot blood pressure distribution in
schoolchildren and to derive population specific reference values
appropriate for age, gender and height status.
Methods
A contiguous area with a population of approximately
1.37 million was selected from Ernakulam district, in central Kerala,
India. Sampling was done by stratified random cluster sampling method.
Schools in the area were stratified into 5 groups according to the
strength of children and a representative sample of 46 schools with a
cumulative population of 25,228 children was randomly chosen. Blood
pressure (BP) and anthropometric data (height and weight) were collected
from 20,263 students of 5-16 years age during the period 2005-06. Children
with body mass index (BMI) more than or equal to 85th percentile of
reference data were considered overweight(12).
The reference data used to identify the cut offs were taken from CDC 2000
data set for BMI(13). A total of 18,931 non-overweight children were
selected from the total sample and used for deriving blood pressure
nomograms. Blood pressure was measured using mercury sphygmomanometer.
Standard methodology, as recommended by the Fourth Report on the
diagnosis, evaluation and treatment of high blood pressure in children and
adolescents, was used to measure blood pressure(11). Three readings of
blood pressures of each child were taken maintaining an interval of 2
minutes between the readings. Mean of the three readings was reported.
Weight and height of each child were recorded using standard methods. The
detailed design and methodology is available in our previous
publication(2).
Statistical analysis
Polynomial regression models were considered to
estimate blood pressure percentiles in relation to sex, age and height.
The same model was adopted previously in computing blood pressure
percen-tiles(11). The model used was a fourth degree polynomial model to
predict adjusted blood pressure as a function of age and height Z score
for both genders separately. The formulae used for expected BP is given in
Annexure I. This expected BP corresponds to mean BP of
that particular age and height Z score (Zht) of the specified
gender. Using this mean BP and the standard deviation derived from our
sample, we derived appropriate values for other BP percentiles. The
advantage of using polynomial regression model is that although the
distribution of height varies greatly with age, the distribution of Zht
does not, thus allowing one to estimate blood pressure percentiles as a
function of age and height with a relatively simple polynomial model
across a wide age range(14).
Results
The descriptive data of the school survey is presented
in Table I. The mean systolic blood pressure was similar in
boys and girls up to the age of 8 years after which girls demonstrated
higher values compared to boys till the age of 15 years. At the age of 16
years, boys demonstrated slightly higher values than girls. The mean
diastolic blood pressure demonstrated a relative increase in girls by 9
years of age, which stayed till the age of 16 years. The relative increase
in systolic blood pressure in girls compared to boys peaked during 11 to
13 years of age. In case of diastolic blood pressure, the relative
increase peaked during 12 to 15 years of age.
Table I


Characteristics of the Study Sample
| |
|
|
Height
(cm) |
Weight
(kg) |
BMI
(kg/m2) |
SBP
(mm Hg) |
DBP
(mm Hg) |
|
|
Age (yr) |
No. |
Mean |
Mean |
Mean |
Mean |
Mean |
|
Boys |
|
|
5 |
198 |
111.6 (5.63) |
17.8 (3.19) |
14.2 (1.53) |
95.2 (8.15) |
61.0 (8.41) |
|
|
6 |
689 |
116.1 (5.61) |
19.5 (3.77) |
14.4 (1.85) |
96.5 (8.68) |
60.9 (8.93) |
|
|
7 |
729 |
122.0 (5.61) |
21.9 (4.71) |
14.6 (2.20) |
97.7 (8.22) |
62.9 (8.75) |
|
|
8 |
788 |
127.4 (6.26) |
24.5 (5.32) |
15.0 (2.26) |
99.5 (9.09) |
64.3 (8.68) |
|
|
9 |
912 |
132.1 (6.32) |
26.8 (5.76) |
15.2 (2.32) |
100.5 (8.56) |
66.0 (8.31) |
|
|
10 |
1109 |
137.1 (6.48) |
29.3 (6.50) |
15.4 (2.48) |
102.1 (8.67) |
67.3 (8.08) |
|
|
11 |
1126 |
141.9 (7.24) |
32.6 (7.94) |
16.1 (2.83) |
103.5 (9.60) |
68.3 (8.24) |
|
|
12 |
1125 |
146.7 (7.87) |
35.9 (9.13) |
16.5 (2.96) |
105.3 (10.0) |
68.6 (8.08) |
|
|
13 |
1024 |
153.7 (8.83) |
40.9 (9.71) |
17.2 (2.99) |
108.0 (11.20) |
69.1 (8.67) |
|
|
14 |
1088 |
159.8 (8.36) |
45.1 (9.60) |
17.5 (2.79) |
111.0 (11.29) |
71.2 (8.25) |
|
|
15 |
687 |
164.2 (7.71) |
49.3 (10.51) |
18.2 (3.05) |
113.8 (10.92) |
72.8 (8.46) |
|
|
16 |
279 |
165.9 (7.5) |
52.4 (11.42) |
18.9 (3.28) |
115.1 (11.44) |
73.2 (8.20) |
|
Girls |
|
|
5 |
222 |
110.0 (5.52) |
17.2 (2.89) |
14.2 (1.57) |
94.1 (9.25) |
59.2 (9.20) |
|
|
6 |
563 |
114.8 (5.55) |
18.9 (3.36) |
14.2 (1.66) |
95.9 (8.44) |
61.7 (7.97) |
|
|
7 |
594 |
121.6 (5.73) |
21.8 (4.61) |
14.6 (2.20) |
97.9 (8.35) |
63.3 (8.32) |
|
|
8 |
667 |
126.2 (6.33) |
23.8 (4.99) |
14.8 (2.16) |
98.8 (9.36) |
63.7 (8.51) |
|
|
9 |
855 |
132.3 (6.58) |
26.7 (5.69) |
15.1 (2.32) |
101.5 (9.36) |
66.5 (8.38) |
|
|
10 |
1178 |
137.6 (7.08) |
29.9 (7.10) |
15.7 (2.62) |
104.4 (9.87) |
68.5 (8.17) |
|
|
11 |
1301 |
142.8 (7.33) |
33.7 (8.01) |
16.3 (2.77) |
107.3 (10.01) |
70.0 (7.85) |
|
|
12 |
1269 |
148.6 (6.68) |
38.2 (8.07) |
17.2 (2.83) |
109.8 (10.35) |
71.7 (7.62) |
|
|
13 |
1388 |
152.1 (6.24) |
41.5 (7.82) |
17.9 (2.84) |
112.3 (10.57) |
72.6 (7.80) |
|
|
14 |
1481 |
154.2 (5.99) |
44.0 (8.53) |
18.5 (3.08) |
113.2 (10.42) |
73.3 (7.85) |
|
|
15 |
813 |
155.3 (6.28) |
45.8 (8.39) |
19.0 (2.88) |
114.4 (10.47) |
74.2 (7.94) |
|
|
16 |
178 |
155.2 (6.58) |
46.6 (8.92) |
19.3 3.28 |
114.7 (10.87) |
74.5 (7.10) |
Figures in parentheses are standard deviations.

BMI: Body mass index; SBP: Systolic blood pressure;

DBP: Diastolic blood pressure.
|
The regression coefficients from polynomial regression
model were derived for both genders separately. The intercept ( a)
for systolic BP was 100.63 in boys and 102.87 in girls. The corresponding
values for diastolic BP was 66.25 and 67.35 respectively. The regression,
co-efficients for various powers of age (b1,
b2,
b3
and b4)
in case of systolic blood pressure for boys were 1.36, 0.17, 0.02 and
–0.0036, respectively. The corresponding figures for girls were 2.66,
0.07, -0.03 and -0.0009. The values (b1,
b2,
b3
and b4)
of diastolic blood pressure for boys were 1.21, –0.08, –0.00013 and
0.0019, respectively. The corresponding values for girls were 1.89, –0.06,
–0.02 and 0.001, respectively. The regression co-efficients for various
powers of height z score (g1,
g2,
g3
and g4)
in case of systolic blood pressure for boys were 2.30, 0.02, –0.028 and
–0.0098, respectively. The corresponding figures for girls were 1.36,
-0.16, 0.015 and 0.016, respectively. The values (g1,
g2,
g3
and g4)
of diastolic blood pressure for boys were 1.18, –0.13, 0.017 and 0.012,
respectively. The corresponding values for girls were 0.89, –0.11, 0.007
and 0.012, respectively. The standard deviation (s)
for systolic BP was 11.08 in boys and 11.6 in girls, and for diastolic BP
was 9.07 in boys and 9.0 in girls.
TABLE II


Height Percentile Values in Centimeters for Boys and Girls
|
Boys |
Girls |
| Age (yr) |
5 |
10 |
25 |
50 |
75 |
90 |
95 |
5 |
10 |
25 |
50 |
75 |
90 |
95 |
| 5 |
103 |
105 |
107 |
112 |
116 |
119 |
121 |
101 |
103 |
107 |
110 |
113 |
117 |
120 |
| 6 |
108 |
109 |
112 |
116 |
120 |
123 |
126 |
106 |
108 |
111 |
115 |
118 |
122 |
124 |
| 7 |
113 |
115 |
118 |
122 |
126 |
129 |
131 |
112 |
115 |
118 |
121 |
125 |
129 |
131 |
| 8 |
117 |
120 |
123 |
127 |
132 |
135 |
138 |
115 |
118 |
122 |
126 |
130 |
134 |
137 |
| 9 |
122 |
124 |
128 |
132 |
136 |
140 |
143 |
122 |
124 |
128 |
132 |
136 |
141 |
144 |
| 10 |
127 |
129 |
133 |
137 |
141 |
145 |
148 |
122 |
124 |
128 |
132 |
136 |
141 |
144 |
| 11 |
131 |
133 |
137 |
142 |
147 |
152 |
154 |
131 |
133 |
138 |
143 |
148 |
152 |
155 |
| 12 |
135 |
137 |
141 |
146 |
152 |
157 |
161 |
137 |
140 |
144 |
149 |
153 |
157 |
159 |
| 13 |
140 |
142 |
148 |
153 |
160 |
165 |
168 |
142 |
144 |
148 |
152 |
156 |
160 |
163 |
| 14 |
145 |
149 |
154 |
161 |
166 |
170 |
173 |
144 |
147 |
150 |
154 |
158 |
162 |
164 |
| 15 |
151 |
155 |
160 |
164 |
169 |
173 |
176 |
145 |
147 |
151 |
156 |
159 |
163 |
165 |
| 16 |
152 |
157 |
161 |
166 |
171 |
174 |
177 |
143 |
146 |
151 |
155 |
160 |
163 |
166 |
The height percentiles for both genders from the study
population were tabulated separately (Table II). Blood
pressure percentile tables were constructed for total sample population
after excluding the overweight children (Tables III and
IV). This was done with the idea that a non-overweight population
should be used to construct a reference nomogram for blood pressure
because it avoids the influence of excess weight on blood pressure
distribution. Application of this data for clinical and epidemiological
purposes is explained in Appendix A. Comparison of blood
pressure distribution pattern of both genders show significant differences
which persist in both systolic and diastolic blood pressures.
TABLE III


Blood Pressure (BP) Percentile Values for Non-overweight Boys in Relation to Age and Height Percentiles
Age
(yr) |
BP
Percentile |
Systolic blood
pressure (mm Hg)
Height percentiles |
Diastolic blood
pressure (mm Hg)
Height percentiles |
| |
|
5 |
10 |
25 |
50 |
75 |
90 |
95 |
5 |
10 |
25 |
50 |
75 |
90 |
95 |
|
5 |
50 |
90 |
91 |
92 |
93 |
95 |
96 |
97 |
57 |
58 |
58 |
59 |
60 |
61 |
61 |
| |
90 |
104 |
105 |
106 |
108 |
109 |
110 |
111 |
69 |
69 |
70 |
71 |
72 |
72 |
73 |
| |
95 |
108 |
109 |
110 |
112 |
113 |
115 |
115 |
72 |
73 |
73 |
74 |
75 |
76 |
76 |
| |
99 |
116 |
116 |
118 |
119 |
121 |
122 |
123 |
78 |
79 |
80 |
80 |
81 |
82 |
82 |
|
6 |
50 |
92 |
93 |
94 |
96 |
97 |
99 |
99 |
58 |
59 |
60 |
61 |
61 |
62 |
62 |
| |
90 |
106 |
107 |
108 |
110 |
111 |
113 |
114 |
70 |
70 |
71 |
72 |
73 |
74 |
74 |
| |
95 |
110 |
111 |
112 |
114 |
116 |
117 |
118 |
73 |
74 |
75 |
75 |
76 |
77 |
77 |
| |
99 |
118 |
119 |
120 |
122 |
123 |
124 |
125 |
79 |
80 |
81 |
82 |
82 |
83 |
83 |
|
7 |
50 |
94 |
94 |
96 |
97 |
99 |
100 |
101 |
60 |
60 |
61 |
62 |
63 |
63 |
64 |
| |
90 |
108 |
109 |
110 |
111 |
113 |
114 |
115 |
71 |
72 |
73 |
74 |
74 |
75 |
75 |
| |
95 |
112 |
113 |
114 |
116 |
117 |
118 |
119 |
75 |
75 |
76 |
77 |
78 |
78 |
79 |
| |
99 |
119 |
120 |
122 |
123 |
125 |
126 |
127 |
81 |
81 |
82 |
83 |
84 |
84 |
85 |
|
8 |
50 |
95 |
95 |
97 |
98 |
100 |
101 |
102 |
61 |
62 |
63 |
64 |
64 |
65 |
65 |
| |
90 |
109 |
110 |
111 |
113 |
114 |
115 |
116 |
73 |
73 |
74 |
75 |
76 |
76 |
77 |
| |
95 |
113 |
114 |
115 |
117 |
118 |
120 |
120 |
76 |
77 |
78 |
78 |
79 |
80 |
80 |
| |
99 |
121 |
121 |
123 |
124 |
126 |
127 |
128 |
82 |
83 |
84 |
85 |
85 |
86 |
86 |
|
9 |
50 |
96 |
97 |
98 |
99 |
101 |
102 |
103 |
63 |
63 |
64 |
65 |
66 |
66 |
67 |
| |
90 |
110 |
111 |
112 |
114 |
115 |
116 |
117 |
74 |
75 |
76 |
77 |
77 |
78 |
78 |
| |
95 |
114 |
115 |
116 |
118 |
119 |
121 |
121 |
78 |
78 |
79 |
80 |
81 |
81 |
82 |
| |
99 |
122 |
122 |
124 |
125 |
127 |
128 |
129 |
84 |
84 |
85 |
86 |
87 |
87 |
88 |
|
10 |
50 |
97 |
98 |
99 |
101 |
102 |
104 |
104 |
64 |
65 |
65 |
66 |
67 |
68 |
68 |
| |
90 |
111 |
112 |
113 |
115 |
116 |
118 |
118 |
76 |
76 |
77 |
78 |
79 |
79 |
80 |
| |
95 |
115 |
116 |
117 |
119 |
120 |
122 |
123 |
79 |
79 |
80 |
81 |
82 |
83 |
83 |
| |
99 |
123 |
124 |
125 |
126 |
128 |
129 |
130 |
85 |
86 |
87 |
87 |
88 |
89 |
89 |
|
11 |
50 |
98 |
99 |
101 |
102 |
104 |
105 |
106 |
65 |
66 |
67 |
67 |
68 |
69 |
69 |
| |
90 |
113 |
113 |
115 |
116 |
118 |
119 |
120 |
77 |
77 |
78 |
79 |
80 |
80 |
81 |
| |
95 |
117 |
118 |
119 |
120 |
122 |
123 |
124 |
80 |
81 |
81 |
82 |
83 |
84 |
84 |
| |
99 |
124 |
125 |
126 |
128 |
130 |
131 |
132 |
86 |
87 |
88 |
89 |
89 |
90 |
90 |
|
12 |
50 |
100 |
101 |
103 |
104 |
106 |
107 |
108 |
66 |
67 |
68 |
68 |
69 |
70 |
70 |
| |
90 |
115 |
115 |
117 |
118 |
120 |
121 |
122 |
78 |
78 |
79 |
80 |
81 |
81 |
82 |
| |
95 |
119 |
120 |
121 |
122 |
124 |
125 |
126 |
81 |
82 |
82 |
83 |
84 |
85 |
85 |
| |
99 |
126 |
127 |
128 |
130 |
131 |
133 |
134 |
87 |
88 |
89 |
89 |
90 |
91 |
91 |
|
13 |
50 |
103 |
104 |
105 |
106 |
108 |
109 |
110 |
67 |
68 |
68 |
69 |
70 |
71 |
71 |
| |
90 |
117 |
118 |
119 |
121 |
122 |
124 |
124 |
79 |
79 |
80 |
81 |
82 |
82 |
83 |
| |
95 |
121 |
122 |
123 |
125 |
126 |
128 |
128 |
82 |
83 |
83 |
84 |
85 |
86 |
86 |
| |
99 |
129 |
129 |
131 |
132 |
134 |
135 |
136 |
88 |
89 |
90 |
90 |
91 |
92 |
92 |
|
14 |
50 |
105 |
106 |
108 |
109 |
111 |
112 |
113 |
68 |
69 |
69 |
70 |
71 |
72 |
72 |
| |
90 |
120 |
120 |
122 |
123 |
125 |
126 |
127 |
80 |
80 |
81 |
82 |
83 |
83 |
84 |
| |
95 |
124 |
124 |
126 |
127 |
129 |
130 |
131 |
83 |
83 |
84 |
85 |
86 |
87 |
87 |
| |
99 |
131 |
132 |
133 |
135 |
136 |
138 |
139 |
89 |
90 |
91 |
91 |
92 |
93 |
93 |
|
15 |
50 |
108 |
109 |
110 |
112 |
113 |
115 |
115 |
69 |
70 |
71 |
71 |
72 |
73 |
73 |
| |
90 |
122 |
123 |
124 |
126 |
127 |
129 |
130 |
81 |
81 |
82 |
83 |
84 |
84 |
85 |
| |
95 |
126 |
127 |
129 |
130 |
132 |
133 |
134 |
84 |
85 |
86 |
86 |
87 |
88 |
88 |
| |
99 |
134 |
135 |
136 |
138 |
139 |
140 |
141 |
90 |
91 |
92 |
93 |
93 |
94 |
94 |
|
16 |
50 |
111 |
111 |
113 |
114 |
116 |
117 |
118 |
71 |
71 |
72 |
73 |
74 |
74 |
75 |
| |
90 |
125 |
126 |
127 |
128 |
130 |
131 |
132 |
82 |
83 |
84 |
85 |
85 |
86 |
86 |
| |
95 |
129 |
130 |
131 |
133 |
134 |
135 |
136 |
86 |
86 |
87 |
88 |
89 |
89 |
90 |
| |
99 |
136 |
137 |
139 |
140 |
142 |
143 |
144 |
92 |
92 |
93 |
94 |
95 |
96 |
96 |
Data constructed from the sample of non-overweight boys (N=9039).
|
TABLE IV


Blood Pressure (BP) Percentile Values for Non-overweight Girls in Relation to Age and Height Percentiles
Age
(yr) |
BP
Percentile |
Systolic blood
pressure (mm Hg)
Height percentiles |
Diastolic blood
pressure (mm Hg)
Height percentiles |
| |
|
5 |
10 |
25 |
50 |
75 |
90 |
95 |
5 |
10 |
25 |
50 |
75 |
90 |
95 |
| 5 |
50 |
92 |
92 |
93 |
94 |
95 |
96 |
96 |
58 |
58 |
59 |
60 |
60 |
61 |
61 |
| |
90 |
107 |
107 |
108 |
109 |
110 |
111 |
111 |
69 |
70 |
70 |
71 |
72 |
72 |
72 |
| |
95 |
111 |
111 |
112 |
113 |
114 |
115 |
115 |
73 |
73 |
74 |
74 |
75 |
75 |
76 |
| |
99 |
119 |
119 |
120 |
121 |
122 |
123 |
123 |
79 |
79 |
80 |
81 |
81 |
82 |
82 |
| 6 |
50 |
92 |
93 |
94 |
95 |
96 |
97 |
97 |
59 |
59 |
60 |
60 |
61 |
61 |
62 |
| |
90 |
107 |
108 |
109 |
110 |
111 |
111 |
112 |
70 |
71 |
71 |
72 |
72 |
73 |
73 |
| |
95 |
111 |
112 |
113 |
114 |
115 |
116 |
116 |
73 |
74 |
75 |
75 |
76 |
76 |
76 |
| |
99 |
119 |
120 |
121 |
122 |
123 |
124 |
124 |
80 |
80 |
81 |
81 |
82 |
82 |
83 |
| 7 |
50 |
94 |
94 |
95 |
96 |
97 |
98 |
98 |
60 |
60 |
61 |
62 |
62 |
63 |
63 |
| |
90 |
108 |
109 |
110 |
111 |
112 |
113 |
113 |
72 |
72 |
73 |
73 |
74 |
74 |
75 |
| |
95 |
113 |
113 |
114 |
115 |
116 |
117 |
117 |
75 |
75 |
76 |
77 |
77 |
78 |
78 |
| |
99 |
121 |
121 |
122 |
123 |
124 |
125 |
125 |
81 |
81 |
82 |
83 |
83 |
84 |
84 |
| 8 |
50 |
95 |
96 |
97 |
98 |
99 |
100 |
100 |
62 |
62 |
63 |
63 |
64 |
64 |
65 |
| |
90 |
110 |
111 |
112 |
113 |
114 |
114 |
115 |
73 |
74 |
74 |
75 |
76 |
76 |
76 |
| |
95 |
115 |
115 |
116 |
117 |
118 |
119 |
119 |
77 |
77 |
78 |
78 |
79 |
79 |
80 |
| |
99 |
122 |
123 |
124 |
125 |
126 |
127 |
127 |
83 |
83 |
84 |
84 |
85 |
85 |
86 |
| 9 |
50 |
98 |
98 |
99 |
100 |
101 |
102 |
102 |
64 |
64 |
65 |
65 |
66 |
66 |
67 |
| |
90 |
113 |
113 |
114 |
115 |
116 |
117 |
117 |
75 |
76 |
76 |
77 |
77 |
78 |
78 |
| |
95 |
117 |
117 |
118 |
119 |
120 |
121 |
121 |
79 |
79 |
80 |
80 |
81 |
81 |
82 |
| |
99 |
125 |
125 |
126 |
127 |
128 |
129 |
129 |
85 |
85 |
86 |
86 |
87 |
87 |
88 |
| 10 |
50 |
100 |
101 |
102 |
103 |
104 |
104 |
105 |
66 |
66 |
67 |
67 |
68 |
68 |
69 |
| |
90 |
115 |
116 |
117 |
118 |
119 |
119 |
120 |
77 |
78 |
78 |
79 |
79 |
80 |
80 |
| |
95 |
119 |
120 |
121 |
122 |
123 |
124 |
124 |
80 |
81 |
82 |
82 |
83 |
83 |
83 |
| |
99 |
127 |
128 |
129 |
130 |
131 |
131 |
132 |
87 |
87 |
88 |
88 |
89 |
89 |
90 |
| 11 |
50 |
103 |
104 |
105 |
106 |
106 |
107 |
108 |
67 |
68 |
69 |
69 |
70 |
70 |
70 |
| |
90 |
118 |
118 |
119 |
120 |
121 |
122 |
122 |
79 |
79 |
80 |
81 |
81 |
82 |
82 |
| |
95 |
122 |
123 |
124 |
125 |
126 |
126 |
127 |
82 |
83 |
83 |
84 |
85 |
85 |
85 |
| |
99 |
130 |
131 |
132 |
133 |
133 |
134 |
135 |
88 |
89 |
89 |
90 |
91 |
91 |
91 |
| 12 |
50 |
106 |
106 |
107 |
108 |
109 |
110 |
110 |
69 |
69 |
70 |
71 |
71 |
72 |
72 |
| |
90 |
120 |
121 |
122 |
123 |
124 |
125 |
125 |
81 |
81 |
82 |
82 |
83 |
83 |
84 |
| |
95 |
125 |
125 |
126 |
127 |
128 |
129 |
129 |
84 |
84 |
85 |
86 |
86 |
87 |
87 |
| |
99 |
133 |
133 |
134 |
135 |
136 |
137 |
137 |
90 |
90 |
91 |
92 |
92 |
93 |
93 |
| 13 |
50 |
108 |
109 |
110 |
111 |
112 |
112 |
113 |
70 |
71 |
71 |
72 |
73 |
73 |
73 |
| |
90 |
123 |
124 |
125 |
126 |
126 |
127 |
128 |
82 |
82 |
83 |
84 |
84 |
85 |
85 |
| |
95 |
127 |
128 |
129 |
130 |
131 |
131 |
132 |
85 |
86 |
86 |
87 |
87 |
88 |
88 |
| |
99 |
135 |
136 |
137 |
138 |
139 |
139 |
140 |
91 |
92 |
92 |
93 |
94 |
94 |
94 |
| 14 |
50 |
110 |
111 |
112 |
113 |
114 |
114 |
115 |
71 |
72 |
72 |
73 |
74 |
74 |
74 |
| |
90 |
125 |
126 |
127 |
128 |
128 |
129 |
130 |
83 |
83 |
84 |
85 |
85 |
86 |
86 |
| |
95 |
129 |
130 |
131 |
132 |
133 |
133 |
134 |
86 |
87 |
87 |
88 |
88 |
89 |
89 |
| |
99 |
137 |
138 |
139 |
140 |
141 |
141 |
142 |
92 |
93 |
93 |
94 |
95 |
95 |
95 |
| 15 |
50 |
111 |
112 |
113 |
114 |
115 |
115 |
116 |
72 |
72 |
73 |
74 |
74 |
75 |
75 |
| |
90 |
126 |
127 |
128 |
129 |
130 |
130 |
131 |
84 |
84 |
85 |
85 |
86 |
86 |
87 |
| |
95 |
130 |
131 |
132 |
133 |
134 |
135 |
135 |
87 |
87 |
88 |
89 |
89 |
90 |
90 |
| |
99 |
138 |
139 |
140 |
141 |
142 |
143 |
143 |
93 |
93 |
94 |
95 |
95 |
96 |
96 |
| 16 |
50 |
112 |
112 |
113 |
114 |
115 |
116 |
116 |
72 |
73 |
74 |
74 |
75 |
75 |
75 |
| |
90 |
126 |
127 |
128 |
129 |
130 |
131 |
131 |
84 |
84 |
85 |
86 |
86 |
87 |
87 |
| |
95 |
131 |
131 |
132 |
133 |
134 |
135 |
135 |
87 |
88 |
88 |
89 |
90 |
90 |
90 |
| |
99 |
139 |
139 |
140 |
141 |
142 |
143 |
143 |
93 |
94 |
95 |
95 |
96 |
96 |
96 |
Discussion
Studies in the past have demonstrated that age
appropriate blood pressure values tend to be more among boys than girls
through out childhood and adolescence(11,15).
The results of our study appear to be at variance to this finding. In our
study, there is a relative increase in mean systolic and diastolic blood
pressures in girls by the age of 9 years (Table I). By the
age of 16 years, both genders have similar systolic blood pressure values.
By the age of 16 years there appears to be minimal differences in
diastolic blood pressure between both genders. Similar data was reported
in a study from Jordan(16).
Early signs of a change in gender based blood pressure
distribution among adolescents are emerging. Comparison of data sets from
US adolescents demonstrated an increasing trend for high blood pressure
among adolescent girls in contrast to a decreasing trend for the same in
adolescent boys(17). The onset of
sexual maturation is associated with increases in systolic and diastolic
blood pressures(18,19). The timing of sexual maturity is different for
boys and girls with the latter attaining it relatively earlier. This
difference could contribute to differences in blood pressure progression
during adolescence. The same reason could explain the lack of difference
in systolic blood pressure and the comparable values in diastolic blood
pressure between the genders by age 16, a time at which majority of the
boys too have attained significant sexual maturity.
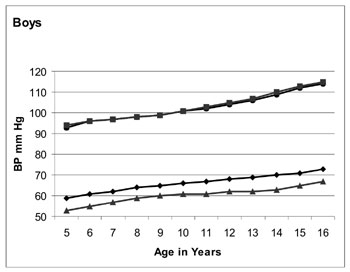
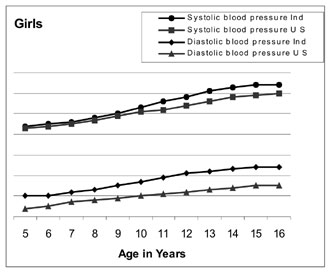
The blood pressure distribution pattern constructed
using data from the present study was compared with an existing
international refe-rence(14). There appears to be minimal difference in
systolic blood pressure among boys from the two populations. There exists
difference among girls in terms of systolic blood pressure with girls from
the present study showing higher values consistently for all age groups (Fig.1).
The difference in diastolic blood pressure appears to be more than the
difference in systolic blood pressure. The same is consistently
demonstrated in a higher magnitude in both gender and in all age groups,
with children from the present study exhibiting higher values. In
addition, the difference in diastolic blood pressure between the
populations appears to be more in girls than boys. Higher values for mean
systolic as well as diastolic blood pressures in comparison to US data
were demonstrated previously for children from Indian, Jordan and
Pakistan(16,20-22). All these
studies have shown consistently higher diastolic blood pressures in
comparison to US children. The differences in systolic blood pressures
were less in magnitude compared to that of diastolic pressures. There
appears to be a consistent difference in diastolic blood pressures between
the present study and the US data(14), pointing towards a population-based
difference. This difference appears to start even before the age of 5
years and persists into late adolescence. Similar trends in Pakistani and
Jordanian children support this observation(16,22).
 |
 |
|
Fig. 1
Comparison of blood pressure between the present sample and US
children. Comparison made for 50 th
percentile of blood pressure of non-overweight children at 50th
percentile of height. Values derived from polynomial regression
model. *Data with permission from ref 14. |
The validity of the results of this study can be
ascertained by the relatively significant correlation for both systolic
and diastolic pressures with height and weight as demonstrated by our
previous publication from the same database(2). Anxiety among children
subjected to blood pressure measurements in a field setting might have
influenced the recordings to certain extent. This limitation was
unavoidable considering the design of the study. The study results deserve
attention due to the anticipated public health implications they predict.
Any demonstrable increase in a known cardiovascular risk factor like blood
pressure in large populations could seriously result in amplification of
morbidity burden resulting from cardiovascular diseases. The morbidity and
mortality pattern from cardiovascular diseases in the coming decades when
the current pediatric population reaches adulthood appears to be one of
grave concern.
Blood pressure distribution in children from this study
exhibits a different pattern in comparison to existing international
reference. Higher blood pressure values for our population in comparison
to international reference values could contribute to heightened disease
burden resulting from hypertension in future. This study underscores the
need for a population specific reference for pediatric blood pressure. The
public health implications of higher blood pressure values in Indian
children starting from a relatively young age could be potentially
serious. Further studies from other parts of India are needed to determine
the influence of diverse socioeconomic, cultural and nutritional factors
on blood pressure in children.
Acknowledgments
The authors thank Mr Abish Sudhakar and Ms Smitha
Mathew for assistance in data management and statistical analysis.
Contributors: MR conceived, designed
and drafted the study. RKK supervised and revised the manuscript for
important intellectual content. MP managed the data and assisted in
drafting of the manuscript and in statistical analysis. KRS did the
statistical analysis and assisted in drafting the manuscript. MR will act
as guarantor of the study.
Funding: The study was fully supported by a
grant from the Indian Council of Medical Research.
Competing interests: None stated.
|
APPENDIX A
Identifying BP percentiles for clinical use
For example, a 14-year old boy with height 166
cms has SBP of 126 mm Hg.
First step is to refer to the height percentile
table (Table II) and see which percentile of height
the boy has. In this case, the boy has 75 th
percentile of height.
Then, refer the values in BP percentile table
corresponding to the case’s sex, age and height percentile. In this
case, the 50 th, 90th, 95th and
99th percentiles of SBP for this 14-year-old boy whose height is in
the 75th percentile are 111, 125, 129 and 136 respectively. The
observed SBP value of 126 mm Hg lies above 90th percentile, but
below 95th percentile. Hence this child will be classified as having
systolic pre-hypertension.
Actual BP percentiles assume clinical
significance in diagnosis, classification and treatment targets of
hypertension in children. Systolic or diastolic BP
³95th
percentile for gender, age and height for 3 or more occasions is
defined as hypertension in children. Pre-hypertension is defined as
systolic BP or diastolic BP that are
³90th
percentile but <95th percentile. Stage 1 hypertension refers to BP
from 95th percentile to the 99th percentile plus 5 mm Hg. Stage 2
hypertension refers to values above stage 1 hypertension. The 50th
percentile of BP is the target attempted when hypertensive children
are subjected to anti hypertensive drug therapy.
Calculating exact BP percentiles using polynomial
regression equation
4
4
Expected BP µ=a
+ S
bj
(y-10)j +
S gk
(Zht)k
j=1
k=1
where y- age in years, ht- height in cms,
a,
b1
...b4
and g1.....g4
are regression co-efficients.
For example, a 14-year old boy with height 166
cms has a height equivalent to 75 th
percentile. The Z score for 75th
percentile = 0.6745. The parameter Age-10 = 4 in this case.
His expected SBP (µ) is,
µ = 100.63 + 1.36(4) + 0.17(4 2)
+ 0.02(43)
- 0.0036(44)
+ 2.30(0.6745) + 0.024(0.67452)
– 0.028(0.67453)
– 0.0098(0.67454)
= 110.70 mmHg.
Suppose his actual SBP is 126 mmHg (x); his SBP Z
score then equals
(x- µ)/ s
= (126-110.70)/11.08 = 1.3809.
The corresponding SBP percentile =
j
(1.3809) × 100% = 91.6 percentile.
|
|
What is Already Known?
• Blood pressure in children shows positive
associations with age and height.
What this Study Adds?
• Blood pressure distribution in Indian children
exhibits significant differences in comparison to existing US
reference values.
|
References
1. Kelishadi R, Ardalan G, Gheiratmand R, Majdzadeh R,
Delavari A, Heshmat R, et al. Blood pressure and its influencing
factors in a national representative sample of Iranian children and
adolescents: the CASPIAN Study. Eur J Cardiovasc Prev Rehabil 2006;
13: 956-963.
2. Raj M, Sundaram KR, Paul M, Deepa AS, Kumar RK.
Obesity in Indian children: time trends and relationship with
hypertension. Natl Med J India 2007; 20: 288-293.
3. Sorof JM, Lai D, Turner J, Poffenbarger T, Portman
RJ. Overweight, ethnicity and the prevalence of hypertension in
school-aged children. Pediatrics 2004;113:475-482.
4. Paradis G, Lambert M, O’Loughlin J, Lavallée C,
Aubin J, Delvin E, et al. Blood pressure and adiposity in children
and adolescents. Circulation 2004; 110: 1832-1838.
5. Wang Y, Monteiro C, Popkin BM. Trends of obesity and
underweight in older children and adolescents in the United States,
Brazil, China and Russia. Am J Clin Nutr 2002; 75: 971-977.
6. Ji CY, Working Group on Obesity in China (WGOC).
Report on childhood obesity in China (4) prevalence and trends of
overweight and obesity in Chinese urban school-age children and
adolescents, 1985-2000. Biomed Environ Sci 2007; 20: 1-10.
7. Chen X, Wang Y. Tracking of blood pressure from
childhood to adulthood: a systematic review and meta-regression analysis.
Circulation 2008; 117: 3171-3180.
8. Thomas F, Rudnichi A, Bacri AM, Bean K, Guize L,
Benetos A. Cardiovascular mortality in hypertensive men according to
presence of associated risk factors. Hypertension 2001; 37: 1256-1261.
9. Chobanian AV, Bakris GL, Black HR, Cushman WC, Green
LA, Izzo JL Jr, et al; National Heart, Lung, and Blood Institute
Joint National Committee on Prevention, Detection, Evaluation, and
Treatment of High Blood Pressure; National High Blood Pressure Education
Program Coordinating Committee. The Seventh Report of the Joint National
Committee on Prevention, Detection, Evaluation, and Treatment of High
Blood Pressure: the JNC 7 report. JAMA 2003; 289: 2560-2572.
10. Lewington S, Clarke R, Qizilbash N, Peto R, Collins
R; Prospective Studies Collaboration. Age-specific relevance of usual
blood pressure to vascular mortality: a meta-analysis of individual data
for one million adults in 61 prospective studies. Lancet 2002; 360:
1903-1913.
11. National High Blood Pressure Education Program.
Working Group on High Blood Pressure in Children and Adolescents. The
fourth report on the diagnosis, evaluation, and treatment of high blood
pressure in children and adolescents. Pediatrics 2004;114:555-576.
12. Barlow SE, Dietz WH. Obesity evaluation and
treatment: Expert Committee recommendations. The Maternal and Child Health
Bureau, Health Resources and Services Administration and the Department of
Health and Human Services. Pediatrics 1998; 102: e29. Available from URL:
http://pediatrics.aappublications.org/cgi/reprint/102/3/e29. Accessed
January 12, 2008.
13. Department of Health and Human Services. Centers
for Disease Control and Prevention, USA. CDC growth charts for the United
States [database on the internet]. Available at http://www.cdc.gov/nchs/data/nhanes/growthcharts/zscore/bmiagerev.xls.
Accessed January 12, 2008.
14. Rosner B, Cook N, Portman R, Daniels S, Falkner B.
Determination of blood pressure percentiles in normal-weight children:
some methodological issues. Am J Epidemiol 2008; 167: 653-666.
15. Jackson LV, Thalange NK, Cole TJ. Blood pressure
centiles for Great Britain. Arch Dis Child 2007; 92: 298-303.
16. Switty TA, Shaheen BH, Habashneh MS, Kelani Z,
Hazza IA. Blood pressure among school children in Jordan. Saudi J Kidney
Dis Transpl 1996; 7: 283-290.
17. Ostchega Y, Carroll M, Prineas RJ, McDowell MA,
Louis T, Tilert T. Trends of elevated blood pressure among children and
adolescents: Data From the National Health and Nutrition Examination
Survey 1988-2006. Am J Hypertens 2009; 22: 59-67.
18. Koziel S, Kolodziej H, Ulijaszek S. Body size, fat
distribution, menarcheal age and blood pressure in 14-year-old girls. Eur
J Epidemiol 2001; 17: 1111-1115.
19. Daniels SR, McMahon RP, Obarzanek E, Waclawiw MA,
Similo SL, Biro FM, et al. Longitudinal correlates of change in
blood pressure in adolescent girls. Hypertension 1998; 31: 97-103.
20. Krishna P, PrasannaKumar KM, Desai N, Thennarasu K.
Blood pressure reference tables for children and adolescents of Karnataka.
Indian Pediatr 2006; 43: 491-501.
21. Verma M, Chhatwal J, George SM. Biophysical profile
of blood pressure in school children. Indian Pediatr 1995; 32: 749-754.
22. Jafar TH, Islam M, Poulter N, Hatcher J, Schmid CH,
Levey AS, et al. Children in South Asia have higher body
mass-adjusted blood pressure levels than white children in the United
States: a comparative study. Circulation 2005; 111: 1291-1297.
|
|
|
 |
|
