|
|
|
Indian Pediatr 2019;56: 23-28 |
 |
Height Velocity Percentiles in Indian
Children Aged 5-17 Years
|
|
Vaman
Khadilkar1,
Anuradha Khadilkar1,
Archana Arya2,
Veena Ekbote1,
Neha Kajale1,
Lavanya Parthasarathy1,
Vivek Patwardhan1,
Supriya Phanse1
and Shashi Chiplonkar1
From Departments of Pediatrics; 1Hirabai
Cowasji Jehangir Medical Research Institute, Jehangir Hospitals, Pune,
Maharashtra and 2Sir Gangaram Hospital, New Delhi; India.
Correspondence to: Dr Anuradha Khadilkar,
Deputy Director, Hirabai Cowasji Jehangir Research Institute, Old
Building Basement, Jehangir Hospital, 32, Sassoon Road, Pune,
Maharashtra 411 001, India.
Email:
[email protected]
Received: September 15, 2017;
Initial review: February 19, 2018;
Accepted: November 20, 2018.
|
|
Objective: To assess height
velocity and develop height velocity percentiles in 5-17-year-old Indian
children; and to study the magnitude and age at peak height velocity.
Design: Mixed longitudinal study.
Setting: Private schools at Pune
and Delhi.
Participants/patients: 2949
children (1681 boys) belonging to affluent class aged 5-17 years
(1473-Pune, 1476-Delhi).
Methods: Annual height and
weight measurements from 2007 to 2013. Total 13214 height velocity
measurements (7724 on boys).
Outcome Measures: Height velocity
percentiles (3rd, 10th, 25th, 50th, 75th, 90th and 97th) constructed
using LMS chart maker.
Results: Age- and gender-specific
height velocity percentiles were generated. Median height velocity in
girls decreased from 5 to 8 years, increased to a peak of 6.6 cm at 10.5
years and then declined to 0.3 cm at 17.5 years. In boys, median height
velocity reduced till 10.5, increased to a peak of 6.8 cms at 13.5 years
and then declined to 1cm by 18 years.
Conclusions: Height velocity
percentiles in 5-17-year-old urban Indian children were constructed.
Keywords: Anthropometry, Growth, Peak height.
|
|
G
rowth assessments are performed by cross-setional
evaluation of child’s height and weight on growth charts that are
constructed on reference populations [1,2]. However, longitudinal rather
than cross-sectional growth references are believed to be better
representative of an individuals’ growth pattern [3,4]. Thus, examining
growth velocity may identify failure to thrive or response to a
treatment early [4].
Pubertal growth spurt is the most rapid growth rate
after infancy. Children differ in timing of onset and tempo of growth in
puberty [5]. Hence, a mean of the growth velocities of individuals from
a reference population does not represent the typical growth curve and
peak velocity of pubertal growth [6]. This effect has been described as
the phase difference. Tanner, et al. [6] shifted the separate
height velocity curves to make their peak height velocities coincide
when they constructed height velocity standards for the British
population in 1966 [6]. Therefore, it is important to consider the phase
difference and the timing of peak height velocity (PHV) to get a true
picture of height velocities of the population being studied.
Longitudinal height velocity charts for North
American, Korean and Swedish children have previously been published
[7-9]. As childhood growth is affected by environmental and genetic
factors, growth velocities of Indian children are likely to be
different, particularly in pubertal years [10]. Thus, the aims of our
study were (i) to assess height velocity and develop height
velocity percentiles in 5-17-year-old apparently healthy Indian children
from two centers from India (Pune and Delhi), and (ii) to
study the magnitude and age at peak height velocity during adolescence
in Indian children.
Methods
This mixed longitudinal study was designed for
assessing height velocity of Indian children aged 5-17 years and was
conducted in Delhi (North) and Pune (West). Although this dataset was
not part of Indian reference growth data, the studies were running
parallelly; thus, methods of school and sample selection were similar
[11]. Briefly, for school selection, nutritionally well-off areas (i.e.
areas without slum clusters) in the city were identified and a list of
schools catering to affluent children was made. Area was then selected
randomly and three schools were selected as chosen by generating random
numbers. The yearly fees of the selected schools were around Rs. 10000
(Indian per capita income 2007-2008, Rs. 2021/month) [11] when the study
was initiated (2007).
All children from 5 till 17 years of age were
annually measured from 2007 till 2013. As children left school, or as
new children entered, children with a minimum of three readings (i.e.
measurements for at least three years) were included in the study.
Hence, in the first year, children were not measured after 15 years
of age (Table I). The study was approved by the Ethics
Committee of the Hirabai Cowasji Jehangir Medical Research Institute,
Pune. Permission and consent was obtained from school management and
parents gave written consent for the use of de-identified data. Assents
from children over 7 years were obtained. Date of births on all children
were recorded from the school registers. Height was measured (Leicester
Height Meter; Child Growth Foundation, London, range, 60-207 cm) using
portable stadiometer and weight was measured using electronic scale
(Salter, Faridabad, India); instruments were calibrated daily using
standard height rod and weights. For height measurement, the child stood
in socks on the flat base of the stadiometer with the back of the head,
shoulder blades, buttocks and heels touching the vertical rod, and head
in Frankfurt plane. Gentle traction was applied to the mandibular
process and headboard lowered. The reading was taken to last completed
mm and two readings were averaged for analysis. Throughout the study,
same model and manufacture stadiometers were used at both the centers.
Mean inter-observer and intra-observer coefficients of variation were
<0.01 (1%) for height, indicating precision of measurements and that
there were no significant differences among observers (P=0.34).
Yearly measure-ments were repeated in all children between July
to September by the same set of observers. Clinical assessments to rule
out major illnesses were performed by pediatricians at both sites and
children with any serious illness, or an illness likely to affect growth
were measured, but were excluded from the study; data for these children
were not entered or analyzed.
TABLE I Baseline Anthropometric Characteristics of the Population
|
Age (years)
|
n |
Gender
|
Height (cm) |
Weight (kg) |
BMI (kg/m2) |
|
5-6 |
85 |
M |
110.8 (5.4) |
18.2 (3.3) |
14.8 (2.0) |
|
101 |
F |
108.5 (5.6) |
17.1 (2.7) |
14.5 (1.6) |
|
6-7 |
88 |
M |
117.4 (5.8) |
21.2 (3.7) |
15.3 (1.7) |
|
124 |
F |
116.8 (5.0) |
20.1 (3.0) |
14.7 (1.5) |
|
7-8 |
128 |
M |
123.4 (6.3) |
24.6 (5.9) |
16.0 (2.8) |
|
141 |
F |
119.9 (6.2) |
21.7 (4.3) |
15.0 ( 2.0) |
|
8-9 |
124 |
M |
129.2 (5.1) |
27.2 (6.8) |
16.2 (3.4) |
|
146 |
F |
124.8 (7.2) |
24.2 (5.0) |
15.4 (2.0) |
|
9-10 |
253 |
M |
133.5 (5.3) |
30.7 (6.9) |
17.1 (3.1) |
|
135 |
F |
134.3 (5.5) |
28.9 (5.9) |
15.9 (2.5) |
|
10-11 |
184 |
M |
137.8 (6.1) |
33.5 (7.5) |
17.5 (3.1) |
|
151 |
F |
142.0 (6.1) |
35.4 (7.0) |
17.5 (2.9) |
|
11-12 |
137 |
M |
143.8 (5.8) |
38.5 (8.6) |
18.5 (3.4) |
|
113 |
F |
146.5 (6.6) |
38.0 (8.2) |
17.6 (3.3) |
|
12-13 |
87 |
M |
150.5 (7.5) |
42.3 (8.6) |
18.6 (3.0) |
|
92 |
F |
151.7 (6.0) |
41.5 (7.4) |
18.0 (2.8) |
|
13-14 |
45 |
M |
154.9 (6.9) |
45.9 (11.1) |
19.0 (3.9) |
|
89 |
F |
159.4 (6.1) |
51.5 (9.9) |
20.2 (3.5) |
|
14-15 |
16 |
M |
163.1 (7.7) |
50.4 (10.2) |
18.9 (3.2) |
|
20 |
F |
155.2 (12.9) |
49.6 (20.4) |
20.1 (5.1) |
|
15-16 |
18 |
M |
169.4 (8.0) |
63.3 (10.9) |
22.1 (3.6) |
|
16 |
F |
156.2 (8.9) |
48.6 (14.4) |
19.8 (4.8) |
|
Data presented in mean (SD). |
Baseline height and weight values (recorded in 2007)
were analyzed by calculating Z-scores for height and weight using Centre
for Disease Control charts and observations which were above and below
+5 and -5 Z-scores were removed [12].
Annualized height velocity was calculated by using
the formula: change in height in centimetres/change in time in years
[13]. Individuals with data entry errors and with less than three height
readings were removed from analysis. Using these data, age and
gender specific smoothed percentiles (3rd, 10th, 25th, 50th, 75th, 90th
and 97th) for height velocity were constructed using the LMS method
[14]. Each variable of interest was summarized by 3 smooth curves
plotted against age representing the median (M), coefficient of
variation (S), and skewness (L) of the measurement distribution [15].
Models were checked using detrended Q-Q plots, Q tests, and worm plots.
LMS values were generated by the LMS method (LMS Chart Maker pro version
2.3); monthly height velocity values were generated; however, six
monthly intervals have been presented here.
Peak velocity centered analysis: Girls and boys
with PHV for two preceding and succeeding years around the peak were
identified. Median and range of PHV’s were calculated on the subset.
For a mixed longitudinal study with minimum of three
time points and the group difference of 0.5 standard deviation units at
each time point, necessary sample size was determined to be 47 per group
for two group comparisons, assuming the attrition rate of 10% at each
time point after the first, to be the same for all the groups, (r1 = 1,
r2 = 0.9, r3 = 0.81), all pairwise correlations of the three repeated
measures to be r= 0.5, and power to be 0.8 at 0.05 level of
significance [16]. Further, for generating percentiles, 200 subjects per
age-sex group is recommen-ded [17]. Therefore, more children were
enrolled per group. This resulted on post hoc power for present mixed
longitudinal study with minimum of three-time points and the current
sample size was adequate to suffice 0.9% power of the study with 5%
level of significance.
Results
A total of 13214 height velocity measurements on 2949
children (Pune -1473, Delhi - 1476) were available (7724 measurements on
boys) from 5 to 17 years. Total 398 (298 boys) deviant observations were
removed from analysis (Web Fig. 1). Table
I summarizes age and gender specific mean (SD) for height and weight
in boys and girls at the beginning of the study. The mean height Z-scores
in boys and girls (-0.2 (1.1), -0.4 (1.1), respectively) and weight Z-scores
(-0.2 (1.1), -0.3 (1.1), respectively) at the time of first measurement
were close to zero in comparison with Indian reference growth data [2].
TABLE II Boys Height Velocity Percentiles (in cm)
|
Age years |
n |
Percentile |
|
|
|
|
|
|
|
|
3rd |
10th |
25th |
50th |
75th |
90th |
97th |
|
5 |
91 |
5.3
|
5.7
|
6.1
|
6.6
|
7.1
|
7.7
|
8.3
|
|
5.5 |
|
5.1
|
5.5
|
6.0
|
6.5
|
7.0
|
7.6
|
8.2
|
|
6 |
200 |
4.9
|
5.3
|
5.8
|
6.3
|
6.8
|
7.4
|
8.0
|
|
6.5 |
|
4.6
|
5.1
|
5.6
|
6.1
|
6.6
|
7.3
|
7.9
|
|
7 |
280 |
4.4
|
4.9
|
5.4
|
5.9
|
6.5
|
7.1
|
7.8
|
|
7.5 |
|
4.2
|
4.7
|
5.2
|
5.7
|
6.3
|
7.0
|
7.7
|
|
8 |
347 |
4.0
|
4.5
|
5.0
|
5.6
|
6.2
|
6.9
|
7.7
|
|
8.5 |
|
3.9
|
4.3
|
4.8
|
5.4
|
6.1
|
6.8
|
7.7
|
|
9 |
388 |
3.7
|
4.2
|
4.7
|
5.3
|
6.0
|
6.8
|
7.7
|
|
9.5 |
|
3.5
|
4.0
|
4.5
|
5.2
|
5.9
|
6.8
|
7.8
|
|
10 |
374 |
3.4
|
3.9
|
4.4
|
5.1
|
5.9
|
6.8
|
8.0
|
|
10.5 |
|
3.3
|
3.8
|
4.4
|
5.1
|
6.0
|
7.0
|
8.3
|
|
11 |
378 |
3.3
|
3.8
|
4.4
|
5.2
|
6.1
|
7.3
|
8.8
|
|
11.5 |
|
3.3
|
3.8
|
4.5
|
5.3
|
6.4
|
7.7
|
9.4
|
|
12 |
377 |
3.3
|
3.9
|
4.6
|
5.6
|
6.7
|
8.2
|
10.1
|
|
12.5 |
|
3.4
|
4.1
|
4.9
|
6.0
|
7.4
|
9.1
|
11.2
|
|
13 |
337 |
3.4
|
4.2
|
5.3
|
6.5
|
8.1
|
10.0
|
12.3
|
|
13.5 |
|
3.2
|
4.2
|
5.4
|
6.8
|
8.6
|
10.6
|
12.9
|
|
14 |
267 |
2.7
|
3.8
|
5.1
|
6.6
|
8.4
|
10.4
|
12.6
|
|
14.5 |
|
2.0
|
3.2
|
4.5
|
6.0
|
7.7
|
9.5
|
11.4
|
|
15 |
216 |
1.4
|
2.5
|
3.7
|
5.1
|
6.5
|
8.1
|
9.8
|
|
15.5 |
|
0.9
|
1.8
|
2.9
|
4.0
|
5.3
|
6.6
|
8.1
|
|
16 |
101 |
0.6
|
1.3
|
2.2
|
3.2
|
4.3
|
5.4
|
6.6
|
|
16.5 |
|
0.4
|
1.0
|
1.7
|
2.4
|
3.3
|
4.3
|
5.3
|
|
17 |
32 |
0.3
|
0.7
|
1.2
|
1.8
|
2.5
|
3.3
|
4.2
|
|
17.5 |
|
0.2
|
0.5
|
0.8
|
1.3
|
1.9
|
2.5
|
3.3
|
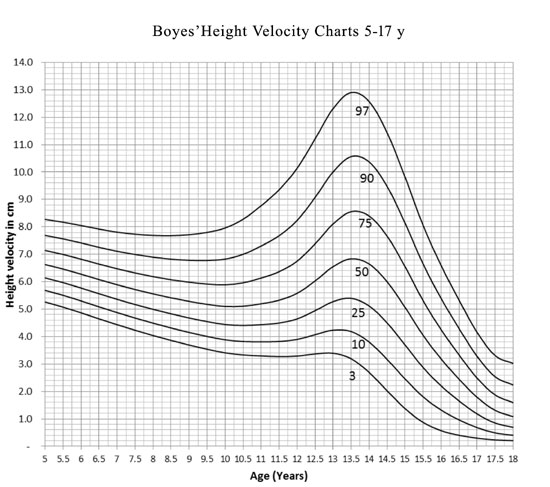
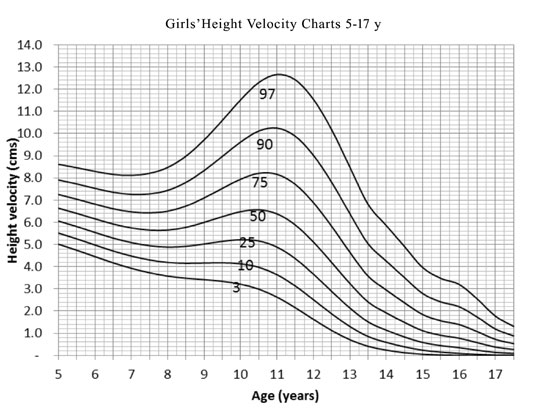
Height velocity percentiles: Table II
and III (Figs. 1 and 2) illustrate the
height velocity percentiles for boys and girls respectively. Height
velocity for boys and girls was higher at 5 years. Median height
velocity in girls decreased from 5 years to 8 years to peak at 10.5
years (6.6 cm) and then declined to 0.3 cm at 17.5 years. In boys,
median height velocity reduced till 10.5 years, peaked at 13.5 years
(6.8 cm) and then declined to 1 cm by 17 years.
 |
|
Fig. 1. Height velocity charts for
boys aged 5-17 years.
|
 |
|
Fig. 2 Height velocity charts for
girls aged 5-17 years.
|
TABLE III Girls Height Velocity Percentiles (in cm)
|
Age years |
n |
Percentile |
|
|
|
|
|
|
|
|
3rd |
10th |
25th |
50th |
75th |
90th |
97th |
|
5 |
51 |
5.0
|
5.5
|
6.1
|
6.6
|
7.3
|
7.9
|
8.6
|
|
5.5 |
|
4.7
|
5.3
|
5.8
|
6.4
|
7.0
|
7.7
|
8.5
|
|
6 |
157 |
4.5
|
5.0
|
5.5
|
6.2
|
6.8
|
7.5
|
8.3
|
|
6.5 |
|
4.2
|
4.7
|
5.3
|
5.9
|
6.6
|
7.4
|
8.2
|
|
7 |
212 |
3.9
|
4.5
|
5.1
|
5.7
|
6.5
|
7.3
|
8.1
|
|
7.5 |
|
3.7
|
4.3
|
4.9
|
5.7
|
6.4
|
7.3
|
8.2
|
|
8 |
282 |
3.6
|
4.2
|
4.9
|
5.7
|
6.5
|
7.4
|
8.5
|
|
8.5 |
|
3.5
|
4.2
|
4.9
|
5.8
|
6.7
|
7.8
|
9.0
|
|
9 |
294 |
3.4
|
4.2
|
5.0
|
6.0
|
7.1
|
8.3
|
9.7
|
|
9.5 |
|
3.3
|
4.2
|
5.1
|
6.3
|
7.5
|
9.0
|
10.6
|
|
10 |
296 |
3.2
|
4.1
|
5.2
|
6.5
|
7.9
|
9.6
|
11.5
|
|
10.5 |
|
3.0
|
4.0
|
5.2
|
6.6
|
8.2
|
10.1
|
12.3
|
|
11 |
324 |
2.6
|
3.6
|
4.9
|
6.4
|
8.2
|
10.2
|
12.7
|
|
11.5 |
|
2.2
|
3.1
|
4.4
|
5.9
|
7.7
|
9.9
|
12.4
|
|
12 |
329 |
1.6
|
2.5
|
3.7
|
5.1
|
6.9
|
9.0
|
11.5
|
|
12.5 |
|
1.1
|
1.9
|
2.9
|
4.2
|
5.8
|
7.8
|
10.2
|
|
13 |
318 |
0.7
|
1.3
|
2.1
|
3.2
|
4.7
|
6.4
|
8.5
|
|
13.5 |
|
0.4
|
0.9
|
1.5
|
2.4
|
3.6
|
5.0
|
6.8
|
|
14 |
208 |
0.2
|
0.6
|
1.1
|
1.9
|
3.0
|
4.3
|
5.9
|
|
14.5 |
|
0.1
|
0.4
|
0.8
|
1.5
|
2.4
|
3.5
|
4.9
|
|
15 |
117 |
0.1
|
0.2
|
0.6
|
1.1
|
1.8
|
2.8
|
4.0
|
|
15.5 |
|
0.0
|
0.2
|
0.4
|
0.9
|
1.6
|
2.4
|
3.5
|
|
16 |
20 |
-
|
0.1
|
0.4
|
0.8
|
1.4
|
2.2
|
-
|
|
16.5 |
|
-
|
0.0
|
0.2
|
0.6
|
1.1
|
1.7
|
-
|
|
17 |
20 |
-
|
0.0
|
0.1
|
0.4
|
0.7
|
1.2
|
-
|
|
17.5 |
|
-
|
0.0
|
0.1
|
0.3
|
0.5
|
0.9
|
-
|
Peak height velocity where a minimum of five
longitudinal readings of height velocities were available in 346 girls
and 330 boys. Peak height velocity of 10.3 cms was achieved at 13.4
years in boys and peak velocity of 9.7 cms was achieved at 10.8 years in
girls.
Discussion
Height velocity percentiles as per age for Indian
children and adolescents from 5-17 years have been presented. The peak
median height velocities were 6.6 cm at 10.5 years in girls and 6.8 cm
at 13.5 years in boys. Velocities were higher in the peak height
velocity (PHV) centered data.
The strength of the study is that annual height
velocities are reported in a large sample over a seven year longitudinal
period, which also eliminated seasonal differences in measurements.
However, a complete serial follow-up of a cohort of children was
incomplete as children entered and left the study. Children under 5
years were not included in this study. The extreme centiles (3 rd
and 97th) were not presented
for age group beyond/6 year due to small sample size. Sexual maturity
staging was not done to correlate with PHV. However, data suggest that
majority of girls and boys achieve PHV by Tanner stage 3 and stage 4,
respectively [18]; peak height velocity centered data is thus presented
in a subset.
Previously published studies have reported data on
height velocity of Indian children [19,20]; however, to the best of our
knowledge, this is one of the few Indian studies to report height
velocities over a 7-year period.
An individual whose height is under the 3 rd
percentile or two standard deviations below mean is considered as
stunted [2]. However, for a height velocity chart, individuals whose
height velocity is under the 25th
percentile are required to be investigated [21]. Most healthy children
tend to keep to the same percentile on distance charts unlike height
velocity where they may not remain in the same centile position as they
grow. Thus, the correlation of height gain in subsequent years is often
lower than correlation of attained height [6]. Taken together, growth
velocity must always be interpreted in conjunction with attained growth.
Thus, for the appropriate investigation of a child with growth failure
use of both the distance and velocity data is necessary.
As children achieve their peak height velocities at
different ages, calculating height velocity based on chronological age
reduces the impact of maximum peak achieved by children during years of
puberty [6]. The peak and age at PHV in current study were similar to
earlier reports [6,14,22,23]. Hauspie, et al. [22] reported
earlier age at PHV, possibly due to secular trend [24]. Satyanarayana,
et al. reported a higher PHV of 7.6 cm at 14 years in boys,
differences could be due to small sample size, different study design
and rural- urban differences [25]. Chinese girls [26] had an earlier
peak (10 years) and boys from the US were taller [14]. Chinese boys had
higher PHV at an earlier age; these differences emphasize the importance
of ethnic specific data [26].
In conclusion, height velocity percentiles in Indian
children aged 5-17 years are presented. These data may be useful to
assess growth velocities in Indian children.
Contributors: VK, AK, AA, ASC conceptualized the
study and its design. AK, VE, NK, LP, SC, VP and SP contributed to data
collection and analysis. All the authors provided critical inputs into
manuscript writing, and approved its final version.
Funding: None; Competing interest: None
stated.
|
What is Already Known?
Growth measurements are based on ethnic
specific distance charts as prepared from cross-sectional
studies.
What This Study Adds?
Age- and gender-specific height velocity
percentiles are presented for Indian children aged 5-17 years.
|
References
1. Gerver W, de Bruin R. Growth velocity: a
presentation of reference values in Dutch children. Horm Res.
2003;60:181-4.
2. Khadilkar V, Yadav S, Agrawal K, Tamboli S,
Banerjee M, Cherian A, et al. Revised IAP growth charts for
height, weight and body mass index for 5- to 18-year-old Indian
children. Indian Pediatr. 2015;52:47-55.
3. Roche AF, Himes JH. Incremental growth charts. Am
J Clin Nutr. 1980; 33:2041-52.
4. de Onis M, Siyam A, Borghi E, Onyango A, Piwoz E,
Garza C. Comparison of the World Health Organization growth velocity
standards with existing US reference data. Pediatrics. 2011;128:e18-26.
5. Marceau K, Ram N, Houts R, Grimm K, Susman E.
Individual differences in boys’ and girls’ timing and tempo of puberty:
Modeling development with non-linear growth models. Dev Psychol.
2011;47:1389-409.
6. Tanner J, Whitehouse R, Takaishi M. Standards from
birth to maturity for height, weight, height velocity, and weight
velocity: British children, 1965. II. Arch Dis Child. 1966;41:613-35.
7. Tanner J, Davies P. Clinical longitudinal
standards for height and height velocity for North American children. J
Pediatr. 1985;107:317-29.
8. Chae H, Suh I, Kwon A, Kim Y, Kim Y, Kang D, et
al. Longitudinal standards for height and height velocity in Korean
children and adolescents: the Kangwha study. [corrected]. J Korean Med
Sci. 2013;28:1512-7.
9. Wikland K, Luo Z, Niklasson A, Karlberg J. Swedish
population-based longitudinal reference values from birth to 18 years of
age for height, weight and head circumference. Acta Paediatr.
2002;91:739-54.
10. Khadilkar V, Khadilkar A. Growth charts: A
diagnostic tool. Indian J Endocr Metab. 2011;15:S166.
11. Khadilkar V, Khadilkar V, Cole J, Sayyad G.
Cross-sectional growth curves for height, weight and body mass index for
affluent Indian children, 2007. Indian Pediatr. 2009;46:477-89.
12. Cole T, Freeman J, Preece M. British 1990 Growth
reference centiles for weight, height, body mass index and head
circumference fitted by maximum penalized likelihood. Stat Med
.1998;17:407-29.
13. Kelly L, Winer K, Kalkwarf H, Oberfield E, Lappe
J, Gilsanz V, et al. Age-based reference ranges for annual height
velocity in US children. J Clin Endocrinol Metab. 2014;99:2104-12.
14. van’t Hof M, Wit J, Roede M. A method to
construct age references for skewed skinfold data, using Box-Cox
transformations to normality. Hum Biol. 1985;57:131-9.
15. Cole T, Green P. Smoothing reference centile
curves: The LMS method and penalized likelihood. Stat Med.
1992;11:1305-19.
16. Hedeker D, Gibbons R, Waternaux C. Sample size
estimation for longitudinal designs with attrition: Comparing
time-related contrasts between two groups. J Educ Behav Stat.
1999;24:70-93.
17. Waterlow JC, Buzina R, Keller W, Lane JM,
Nichaman MZ, Tanner JM. The presentation and use of height and weight
data for comparing the nutritional status of groups of children under
the age of 10 years. Bull World Heal Org. 1977;55:489-98.
18. Granados A, Gebremariam A, Lee J. Relationship
between timing of peak height velocity and pubertal staging in boys and
girls. J Clin Res Pediatr Endocrinol. 2015;7:235.
19. Dabas A, Khadgawat R, Gahlot M, Surana V, Mehan
N, Ramot R, et al. Height velocity in apparently healthy North
Indian school children. Indian J Endocrinol Metab. 2018;22:256-60.
20. Rao S, Joshi S, Kanade A. Height velocity, body
fat and menarcheal age of Indian girls. Indian Pediatr. 1998;35:619-28.
21. Brook C, Hindmarsh P, Healy M. A better way to
detect growth failure. Br Med J (Clin Res Ed). 1986;293:1186.
22. Hauspie R, Das S, Preece M, Tanner J. A
longitudinal study of the growth in height of boys and girls of West
Bengal (India) aged six months of 20 years. Ann Hum Biol. 1980;7:429-40.
23. Buckler J, Wild J. Longitudinal study of height
and weight at adolescence. Arch Dis Child. 1987;62:1224-32.
24. Toppari J, Juul A. Trends in puberty timing in
humans and environmental modifiers. Mol Cell Endocrinol. 2010;324:39-44.
25. Satyanarayana K, Radhaiah G, Mohan R, Thimmayamma
B, Rao N, Rao B, et al. The adolescent growth spurt of height
among rural Indian boys in relation to childhood nutritional background:
An 18-year longitudinal study. Ann Hum Biol. 1989;16:4,289-300.
26. Lee T, Chao T, Tang R, Hsieh C, Chen S, Ho L. A
longitudinal study of growth patterns in school children in Taipei area
I: Growth curve and height velocity curve. J Chin Med Assoc.
2004;67:67-72.
|
|
|
 |
|
