|
|
|
Indian Pediatr 2010;47: 97-100 |
 |
Prevalence of Mycobacterium tuberculosis
Infection in Children in Western Uttar Pradesh |
|
Vipin M Vashishtha and T Jacob John
From Mangla Hospital, Shakti Chowk, Bijnor, Uttar
Pradesh, India.
Correspondence to: Vipin M Vashishtha, Director and
Consultant pediatrician, Mangla Hospital, Shakti Chowk, Bijnor, Uttar
Pradesh, 246 701, India.
Email: [email protected]
Received: February 18, 2009;
Initial review: March 12, 2009;
Accepted: September 21, 2009.
Published online 2009 April 1.
PII:S097475590800410-2
|
|
Abstract
This study was conducted to estimate the prevalence
of tubercular infection and compute the Annual risk of tuberculosis
infection (ARTI) in Bijnor district of western Uttar Pradesh through a
hospital-based tuberculin survey conducted at a pediatric hospital. A
total of 1085 children below 18 years (0-4 years 866, 5-17 years 219),
attending the out-patient department during October 2007 through
September 2008 were included. Tuberculin skin test using standard PPD
RT23 with Tween 80 was performed on every 4th child attending the
out-patient department and induration was measured after 48 to 72 hours.
Using a cut-off of 15 mm among 0-4 y aged children, the average
prevalence rate was 7.4%, and using cut-off of 10 mm in 5-17 y age group
the average prevalence rate was 26.9%. ARTI was 4.11% (95% CI 3.09-5.14)
and 3.50 % (2.46-4.48), respectively in the two age groups.
Key words: Annual rate of tuberculosis infection, Child,
India, Prevalence, Tuberculin skin test, Tuberculosis.
|
|
Tuberculin surveys help us to estimate the
prevalence of tuberculosis (MTb) infection and to compute the annual
incidence (annual risk) of MTb infection (ARTI)(1). Tuberculosis control
is defined as cumulative prevalence of <1% infection by age 14 years
(2-7). This translates to an average ARTI of about 0.07% below 14 years of
age(2-7). Currently ARTI is about 1% per year in many regions of India
(5-9). In the absence of any baseline data from western Uttar Pradesh, we
conducted this tuberculin test survey.
Methods
This study was conducted at a secondary-care pediatric
hospital in Bijnor, western Uttar Pradesh. Ethical clearance was obtained
from the ethics committee of the hospital. The study population consisted
of children below 18 years, attending the out-patient department (OPD)
during October 2007 through September 2008. Every 4th child attending the
OPD was included, irrespective of the presenting complaints, avoiding bias
or possible non-random clustering effect that might have occurred if all
children had been tested at one point of time. Exclusion criterion was any
illness that included TB in the differential diagnosis.
The tuberculin skin test (TST) was performed using the
standard PPD RT23 with tween 80 (Span Diagnostics, Sachin, Gujarat; dose
equivalent to 5 TU old tuberculin). However, it is to be understood that
the 5 TU is equivalence value for standardization - 2 TU PPD with Tween 80
has potency equal to 5TU old tuberculin. Test result was read after 48 to
72 hours by one of the authors and recorded as the transverse diameter (in
millimeters) of palpable induration(1).
The study children were grouped in two subsets, 0-4
years and 5-17 years. The prevalence rates in both the subsets were
estimated at different cut-off values.
The annual risk of MTb infection (ARTI) was calculated
from the prevalence of infection (P) by using the equation: ARTI = l – (l
– P) 1/A where A is the mean age of
tested children (6,9,10). Prevalence frequencies of infection were
analyzed by Chi-sqare test to calculate P values.
Results
A total of 1137 children were recruited; 1085 (95.4%)
of them were test-read. The age of tested children ranged from infants to
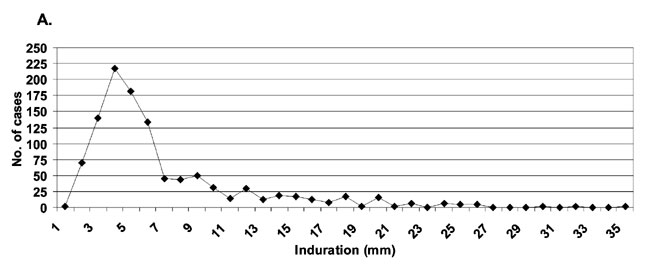
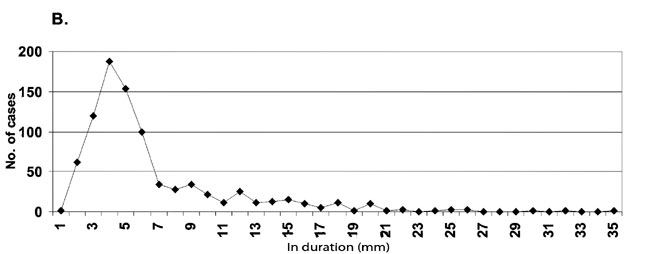
17 years (Table I). The distribution of tuberculin
indurations (Figure 1) in the entire study children (Panel
A) as well as in the age-group of 0-4 years (Panel B) appeared to be
bimodal, with the first mode clearly at 4 mm. As the second mode was not
clearly demarcated, the antimode could not be precisely identified.
Visually the best fit antimode appears to be at 12 or 14 mm. The
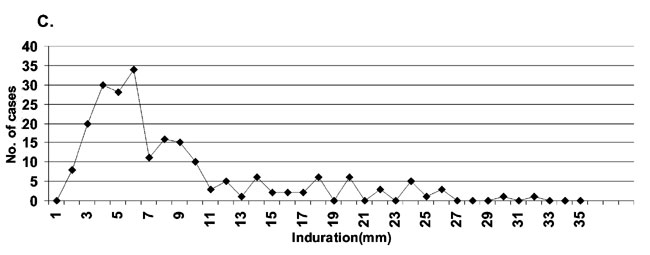
distribution of tuberculin indurations in the age group 5-17 years (Panel
C) appeared to be trimodal, with the modes of the first 2 clusters at 7
and 9-10 mm, respectively and the 2 antimodes were at 8 and 12 mm,
respectively.
TABLE I


Prevalence of Tubercular Infection in the Study Population
|
Age |
0-4 years |
5-17 years |
| |
(n=866) |
(n=219) |
| Mean age |
1.8 y |
8.8 y |
| Median induration (IQR) |
5 (4-7) |
6 (4-10) |
| Mean induration (SD) |
6.4 (4.5) |
8.4 (6.1) |
| Prevalence (95% CI) |
7.4 (1.8) |
26.9 (6.9) |
| ARTI (95% CI) |
4.1 (3.1-5.1) |
3.5 (2.5-4.5) |
|
ARTI:
Annual risk of tuberculosis infection. |
The detection of the antimode for the determination of
the cut off value is an important step in distinguishing MTb-specific
response from non-specific response(6,7,9,11). Since the antimode was not
clear, to measure the prevalence of MTb infection, we used 15 mm as a
conservative cut-off value in the first subgroup (0-4 y), to minimize the
inclusion of responses induced by BCG or other environmental mycobacteria
and to increase the confidence of identifying MTb infection(12).
Similarly, we used 10 mm (midway between the 2 antimodes) as cut off for
children in the second subgroup (5-17 y) to measure the prevalence of MTb
infection.
The prevalence rates of MTb infection in different age
groups was 6.1 to 6.7% (0-2 y), 12.7% (3-4 y), 20.5 to 27.8% (5-10 y),
47.6% (11-12 y) and 50% (13-16 y). There was no significant sex-wise
difference.
Discussion
Our results show alarmingly high rates of MTb infection
prevalence in children and consequently, very high ARTI values. However,
our study has some limitations. Strictly speaking, the study subjects do
not ‘represent’ children in the community. In order to minimize the
potential for over-representation of MTb infected children, we selected a
systematic sample of every fourth child. To maximize specificity, even at
the cost of some sensitivity, we chose PPD reaction cut off values of 15
mm for children under 5, even though the antimode was 12 or 14 mm.
Similarly, we chose a cut off value of 10 mm for children above 4 years,
even though the first antimode was 8mm. Many other investigators have also
used such cut off values(6,9,12). The study methodology was similar to
that described for TST surveys(1,3,7). We did not attempt to correlate
tuberculin sensitivity with a history of BCG vaccination as many studies
have shown that it does not interfere with TST result in children at and
above 5 years(6,7). As for children below 5, by using 15 mm as cutoff
value we have avoided cross reactions to BCG(6,7).
There is paucity of data on Mtb prevalence and ARTI
rates in various districts of Uttar Pradesh. One community based
tuberculin survey had been conducted amongst 1-9 years old rural children
in three districts of central and eastern UP(13). The ARTI computed from
the prevalence of infection, using the cut off value of 14 mm, was 2.3% in
rural areas of Rae Barelli, 1.9% in Hardoi and 1.5% in Jaunpur(13). These
rates are among the highest reported anywhere in India, showing relatively
high intensity of transmission of MTb.
Our study results show even higher ARTI in Bijnor –
4.11% below 5 yr and 3.5% between 5 and 17 yr. There were 4 age intervals
when the rise in infection frequency were relatively steep, namely during
infancy (0 to 6%), during 2 to 3 yr (6.8 to 12.8%), during 4 to 5 yr (12.8
to 20.5%) and during 9/10 to 11/12 yr (27.8 to 47.6%). Whether this
pattern is artifactual or real can only be settled by a larger survey of
PPD response in children selected from the community.
The aim of Revised National Tuberculosis Control
Program is to bring down the infection rate to <1% by 14 years of age, for
an annual infection frequency of 0.07%(3,4,7,8). Against that goal, the
frequency of 3.5-4.11% is 50 times higher. By 14 years the infection
frequency had gone up to 50%, also clearly over 50 times higher than the
goal of TB control(3,4,7,8).
Our findings should be taken as an alert to the
National TB control programme and program officers should conduct
systematic community based tuberculin surveys to independently measure the
prevalence and incidence of MTb infection in Bijnor as well as in other
populations in western UP.
Funding: None.
Competing interest: None stated.
|
What This Study Adds?
• The population studied showed an Annual rate of
tuberculosis infection of >3%, which is higher than that in other
regions of UP and other States in India.
|
References
1. Reider HL. Methodological issues in the estimation
of the tuberculosis problem from tuberculin surveys. Tuberc Lung Dis 1995;
76: 114-121.
2. Musher DM. How contagious are common respiratory
tract infections? New Eng J Med 2003; 348: 1256-1266.
3. Park K. Tuberculosis. Park’s textbook of Preventive
and Social Medicine. 15th ed. Jabalpur: Banarsidas Bhanot Publishers;1997.
4. History of TB Control. Available from: http://www.tbcindia.org/history.asp.
Accessed on 11 February, 2008.
5. John TJ. Tuberculosis control, without protection
from BCG. Indian Pediatr 2000; 37: 9-18.
6. Gopi PG, Subramani R, Nataraj N, Narayanan PR.
Impact of BCG vaccination on tuberculin surveys to estimate annual risk of
tuberculosis infection in south India. Indian J Med Res 2006; 124: 71-76.
7. John TJ. BCG, tuberculin surveys and annual rate of
tuberculosis infection in south India. Indian J Med Res 2007; 125: 95-98.
8. Khatri GR. National Tuberculosis Control Program. J
Indian Med Assoc 1996; 94: 370-375.
9. Chadha VK, Agarwal SP, Kumar P, Chauhan LS, Kollapan
C, Jaganath PS, et al. Annual risk of tuberculous infection in four
defined zones of India: a comparative picture. Int J Tub Lung Dis 2005; 9:
569-575.
10. Cauthen GM, Pio A, ten Dam HG. Annual risk of
tuberculous infection. World Health Organization, Geneva. 1988. WHO
document WHO/TB/88. p.154.
11. John TJ, Frimodt-Moller J, Feldman RA, Jayabal P,
Kamath KR. Infection and disease in a group of south Indian families.
Indian J Med Res 1971; 59: 1727-1736.
12. Chadha VK, Vaidyanathan PS, Jaganntha PS,
Unnikrishnan KP, Savanur SJ, Mini PA. Annual risk of tuberculosis
infection in the western zone of India. Int J Tuberc Lung Dis 2003; 7:
536-542.
13. Chadha VK, Jagannatha PS, Vaidyanathan PS, Singh S,
Lakshminarayana. Annual risk of tuberculous infection in rural areas of
Uttar Pradesh, India. Int J Tuberc Lung Dis 2003; 7: 528-535.
|
|
|
 |
|